Fig. 10
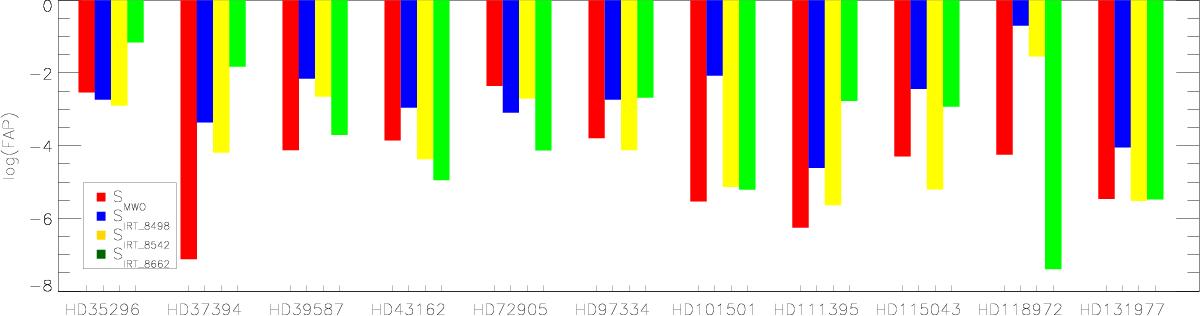
Logarithm of the estimated FAPs of the derived periods in the individual time series vs. objects. The red bars show the log(FAP) values for the period derived from the SMWO time series, the blue bars that from the SIRT_8498 time series, the yellow bars that from the SIRT_8542 and the green bars that from the SIRT_8662 time series.
Current usage metrics show cumulative count of Article Views (full-text article views including HTML views, PDF and ePub downloads, according to the available data) and Abstracts Views on Vision4Press platform.
Data correspond to usage on the plateform after 2015. The current usage metrics is available 48-96 hours after online publication and is updated daily on week days.
Initial download of the metrics may take a while.