Fig. 7
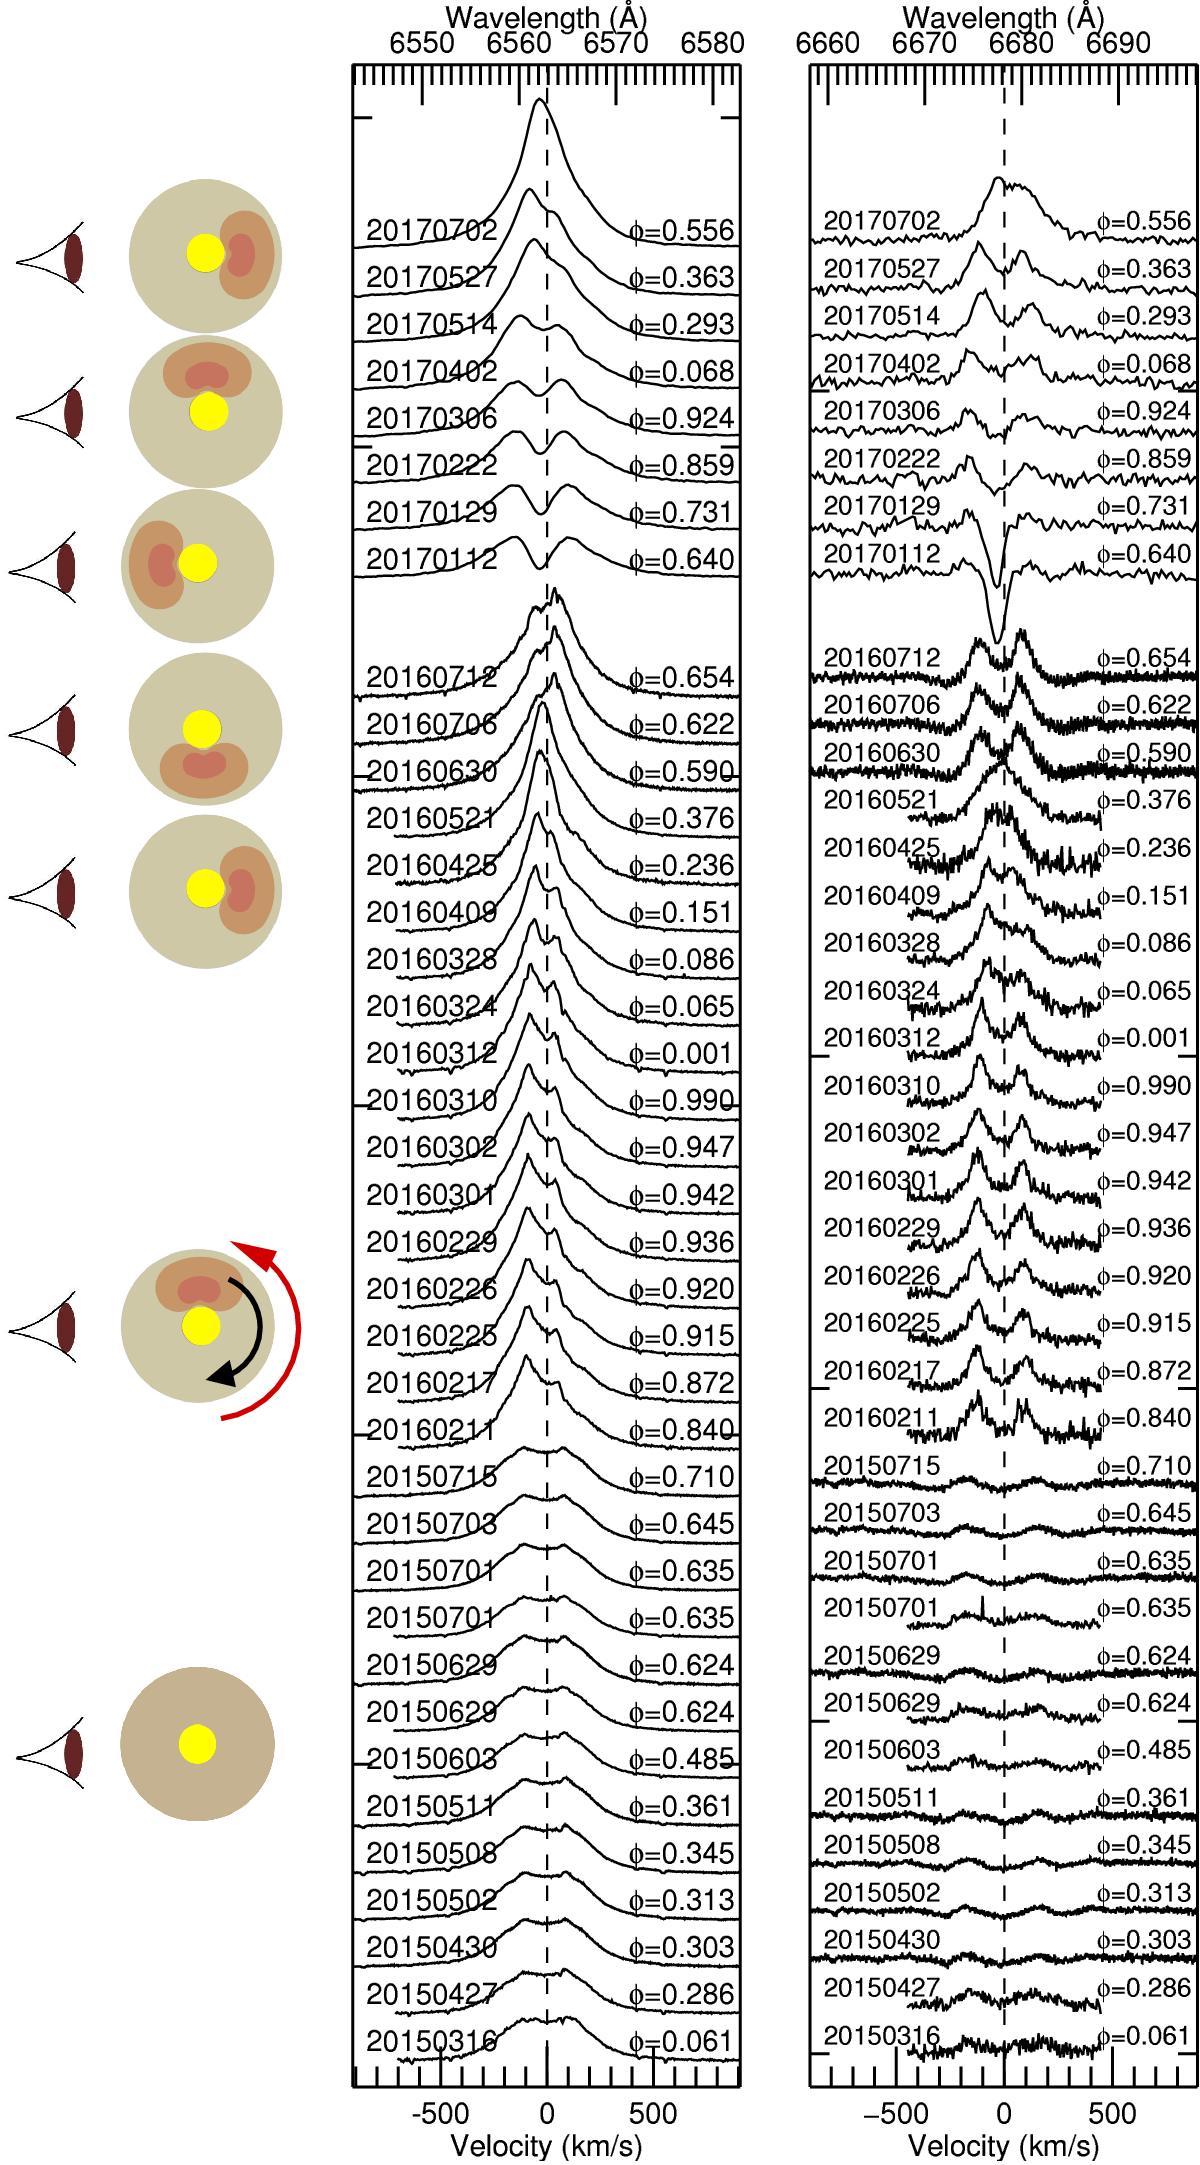
Optical high-resolution SMARTS/CHIRON, SALT/HRS, and SALT/RSS spectra of H 1145-619 from March 2015 (bottom) to July 2017 (top). Left panel: Hα profiles are shown. Right panel: He i 6678 Å profiles are shown. Same coding as in Fig. 6. The rest wavelengths for each line are indicated with black dashed lines and the dates and the orbital phases are indicated on the sides of each line. The flux scale is arbitrary and different for each panel. The one-armed density scheme has been adapted from Telting et al. (1994) and is added on the left part of the figure. The red arrow indicates the sense of the motion of the material in the circumstellar disc and the black arrow indicates the sense of the propagation of the density wave.
Current usage metrics show cumulative count of Article Views (full-text article views including HTML views, PDF and ePub downloads, according to the available data) and Abstracts Views on Vision4Press platform.
Data correspond to usage on the plateform after 2015. The current usage metrics is available 48-96 hours after online publication and is updated daily on week days.
Initial download of the metrics may take a while.