Fig. 4
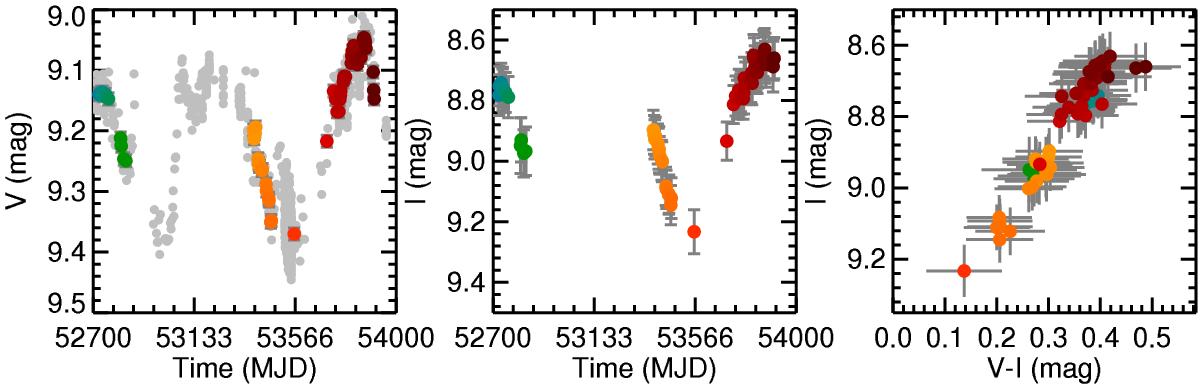
V-band light curve (left), I-band light curve (middle), and colour–magnitude diagram (right) from March 2003 to September 2006. In the V-band light curve, all the observations are plotted in grey, but only those simultaneous with the I-band observations were used in the colour–magnitude diagram. The points in the outbursts were not used. Different colours were used to represent the temporal scale.
Current usage metrics show cumulative count of Article Views (full-text article views including HTML views, PDF and ePub downloads, according to the available data) and Abstracts Views on Vision4Press platform.
Data correspond to usage on the plateform after 2015. The current usage metrics is available 48-96 hours after online publication and is updated daily on week days.
Initial download of the metrics may take a while.