Fig. 3
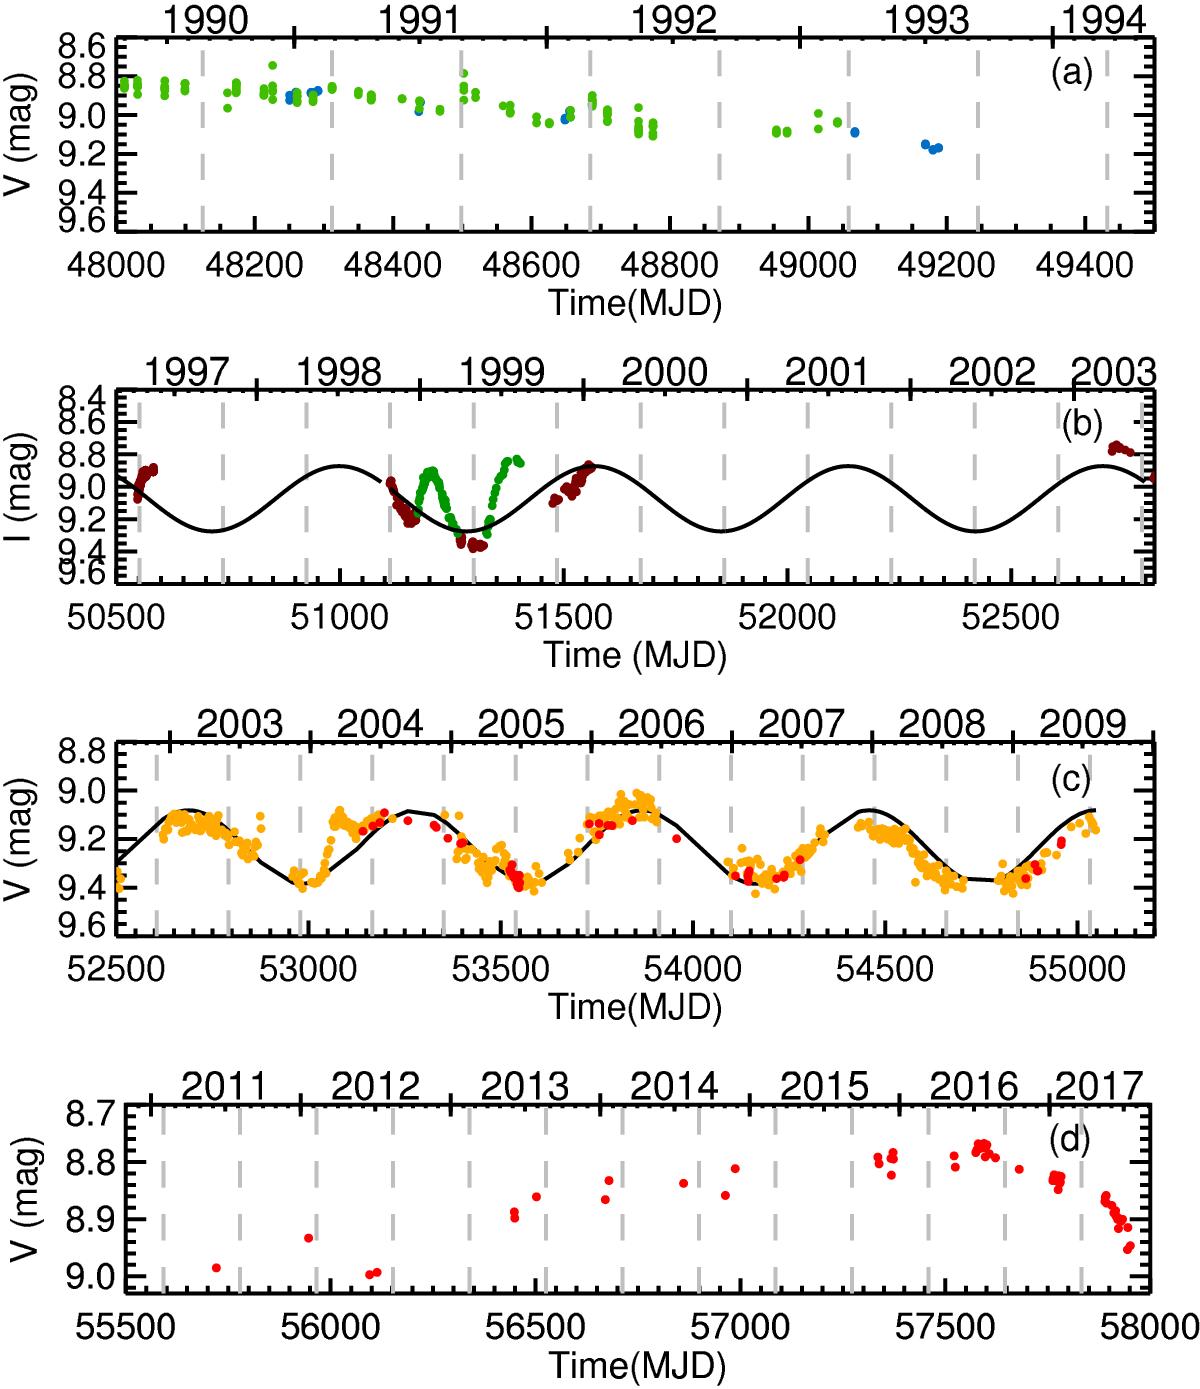
Optical light curves of H 1145-619 showing different optical behaviour in each period. From top to bottom, panel a: V-band light curve is represented. Light blue points come from the ESO Long-Term Photometric Variable Project catalogues (Sterken et al. 1995), green points are from Hipparcos (Perryman et al. 1997). Panel b: I-band data from ASAS-2 are represented; the optical outbursts are indicated in green and observations affected by superorbital variations in brown; see text. Panel c: V-band data from ASAS-3 (orange points) and from INTEGRAL/OMC data (red points) are shown. Panel d: INTEGRAL/OMC data are shown. Black solid lines in the second and third plots indicate the sinusoidal fit to the superorbital variations. The periastron passages were calculated using the ephemeris Porb = 186.68 d; T0 = MJD 48 871.6 (Wilson-Hodge 1999) and are indicated with grey dashed lines (they are indicated in the subsequent light curves in the paper).
Current usage metrics show cumulative count of Article Views (full-text article views including HTML views, PDF and ePub downloads, according to the available data) and Abstracts Views on Vision4Press platform.
Data correspond to usage on the plateform after 2015. The current usage metrics is available 48-96 hours after online publication and is updated daily on week days.
Initial download of the metrics may take a while.