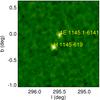
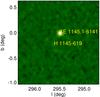
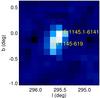
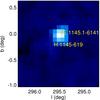
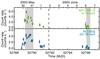
Fig. 11
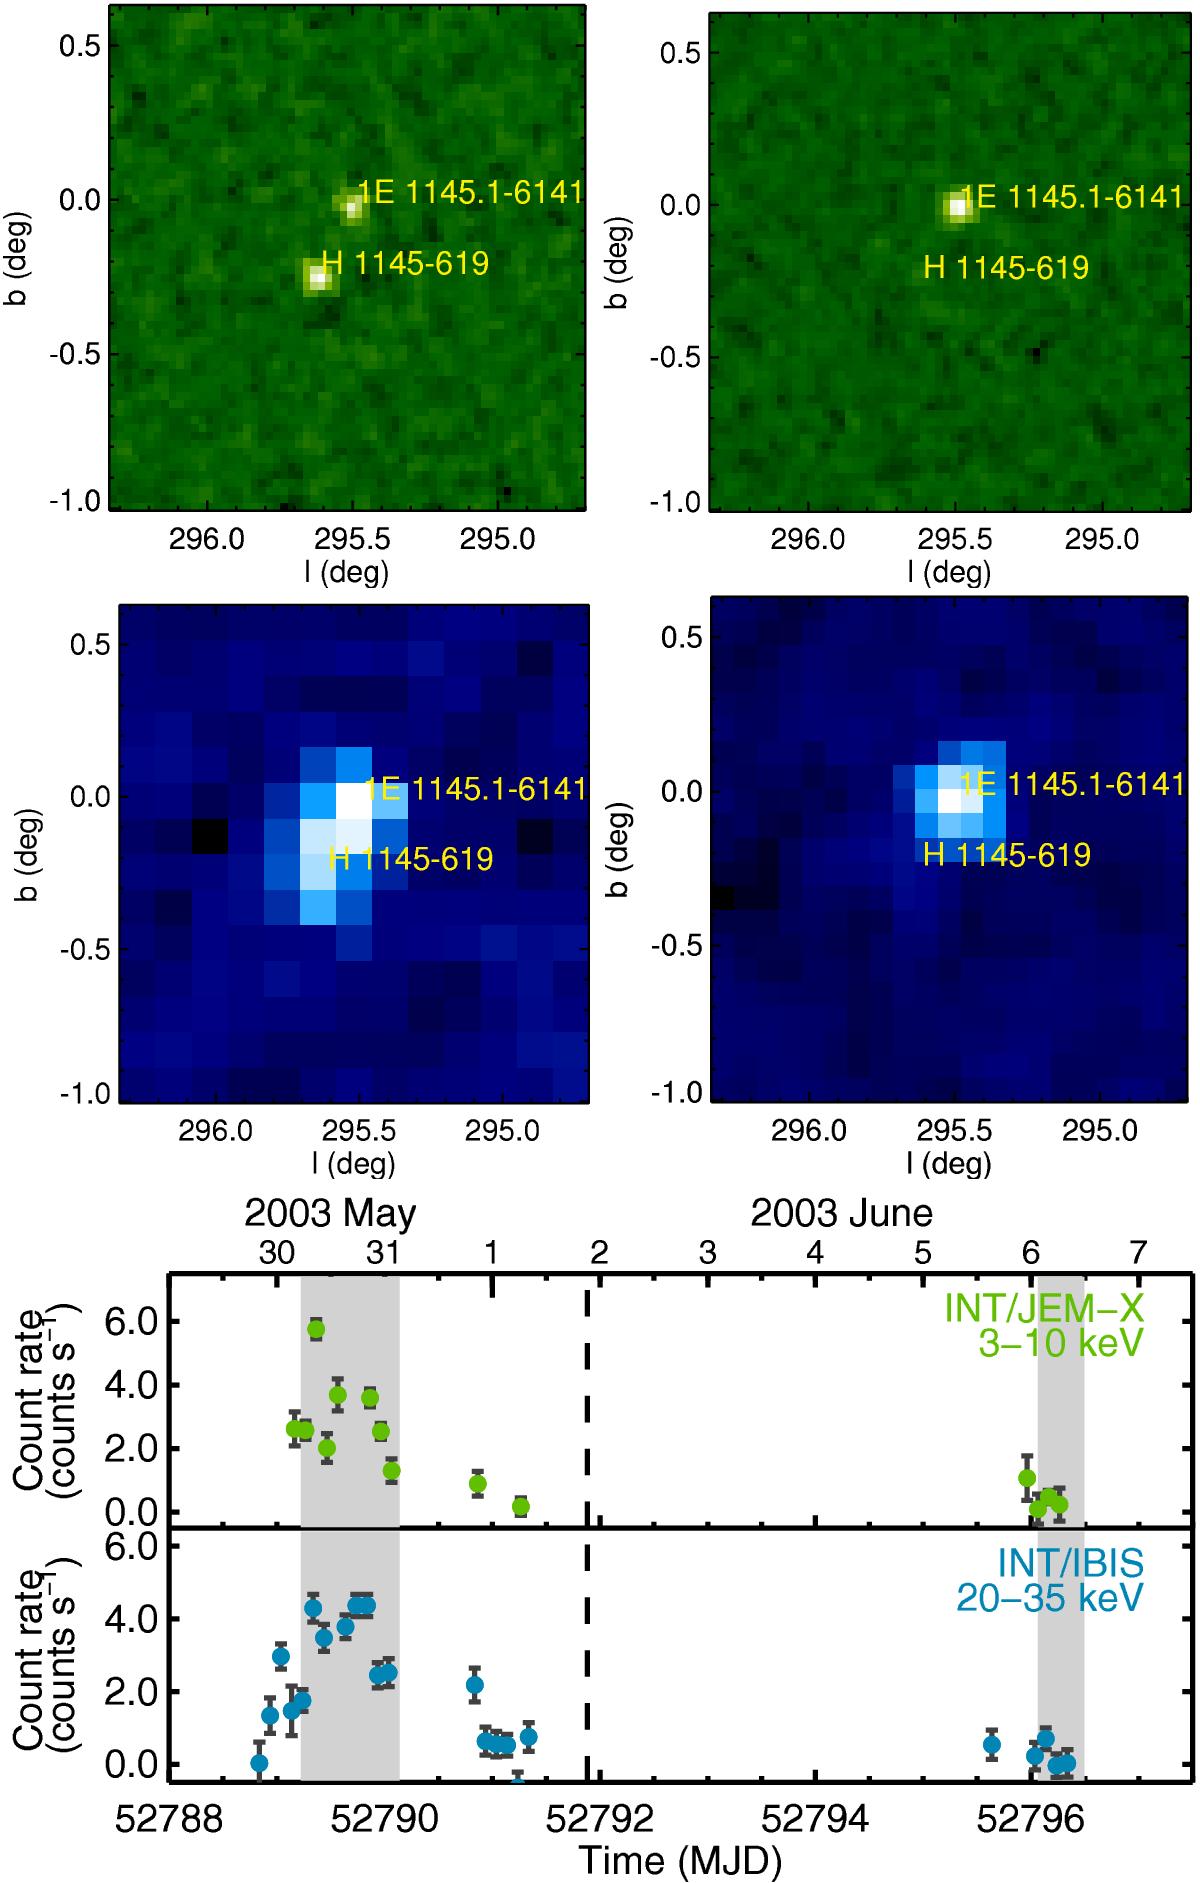
Green panels: JEM-X images in the 3–10 keV energy band; blue panels: IBIS/ISGRI images in the 20–35 keV energy range of H 1145-619 in outburst (left) and quiescence (right) in the epoch of the 2003 outburst. The field of view is of 2°× 2° and H 1145-619 is the source located more to the south and east appearing only in the images from the outburst, and the other source appearing in all the images is 1E 1145.1-6141. Bottom panels: corresponding light curves of H 1145-619 are plotted. The data used to extract the images are shown with a grey shadow.
Current usage metrics show cumulative count of Article Views (full-text article views including HTML views, PDF and ePub downloads, according to the available data) and Abstracts Views on Vision4Press platform.
Data correspond to usage on the plateform after 2015. The current usage metrics is available 48-96 hours after online publication and is updated daily on week days.
Initial download of the metrics may take a while.