Fig. 1
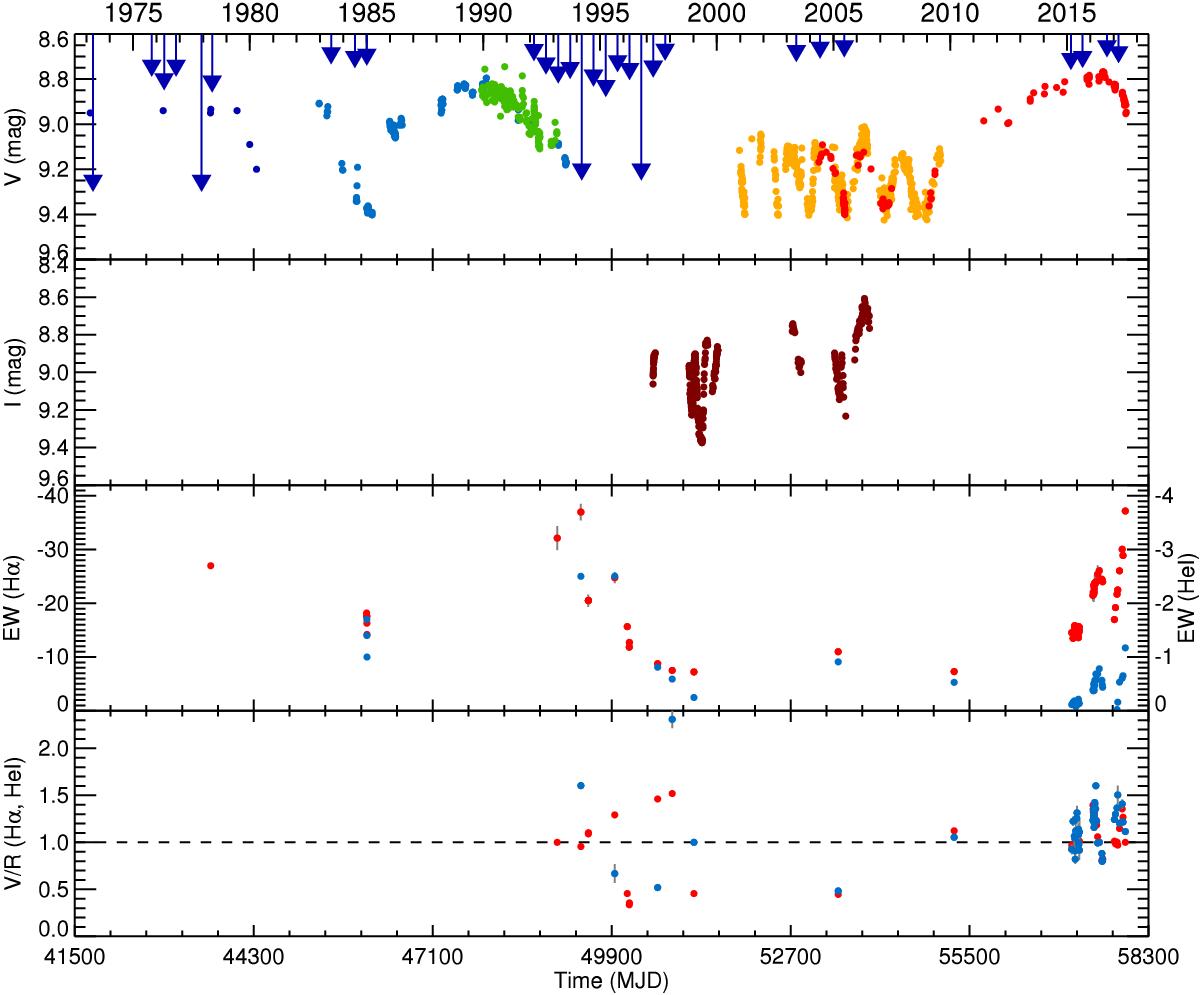
Optical light curves of H 1145-619 from 1973 to 2015. The X-ray outbursts are indicated with dark blue arrows with lengths proportional to the outburst fluxes. First panel: V-Johnson optical light curves. Dark blue points come from the literature (Jones et al. 1974; Hammerschlag-Hensberge et al. 1980; Pakull et al. 1980), light blue points are from the ESO Long-Term Photometric Variable Project (Sterken et al. 1995), green points are from Hipparcos (Perryman et al. 1997), orange points come from ASAS-3, and the red points from INTEGRAL/OMC data. Second panel: I-band photometric points from ASAS-2 are shown. Third panel: EW for Hα (red points) and He i 6678 Å (blue points) are shown. We included 1978 and 1985 measurements by Jones et al. (1974) and Cook & Warwick (1987), respectively, we re-analysed the observations from 1993 to 1996 published in Stevens et al. (1997), and we present in this work new data and results from 1997 to 2016. Fourth panel: V/R for the same spectra (see text) are shown.
Current usage metrics show cumulative count of Article Views (full-text article views including HTML views, PDF and ePub downloads, according to the available data) and Abstracts Views on Vision4Press platform.
Data correspond to usage on the plateform after 2015. The current usage metrics is available 48-96 hours after online publication and is updated daily on week days.
Initial download of the metrics may take a while.