Fig. 3
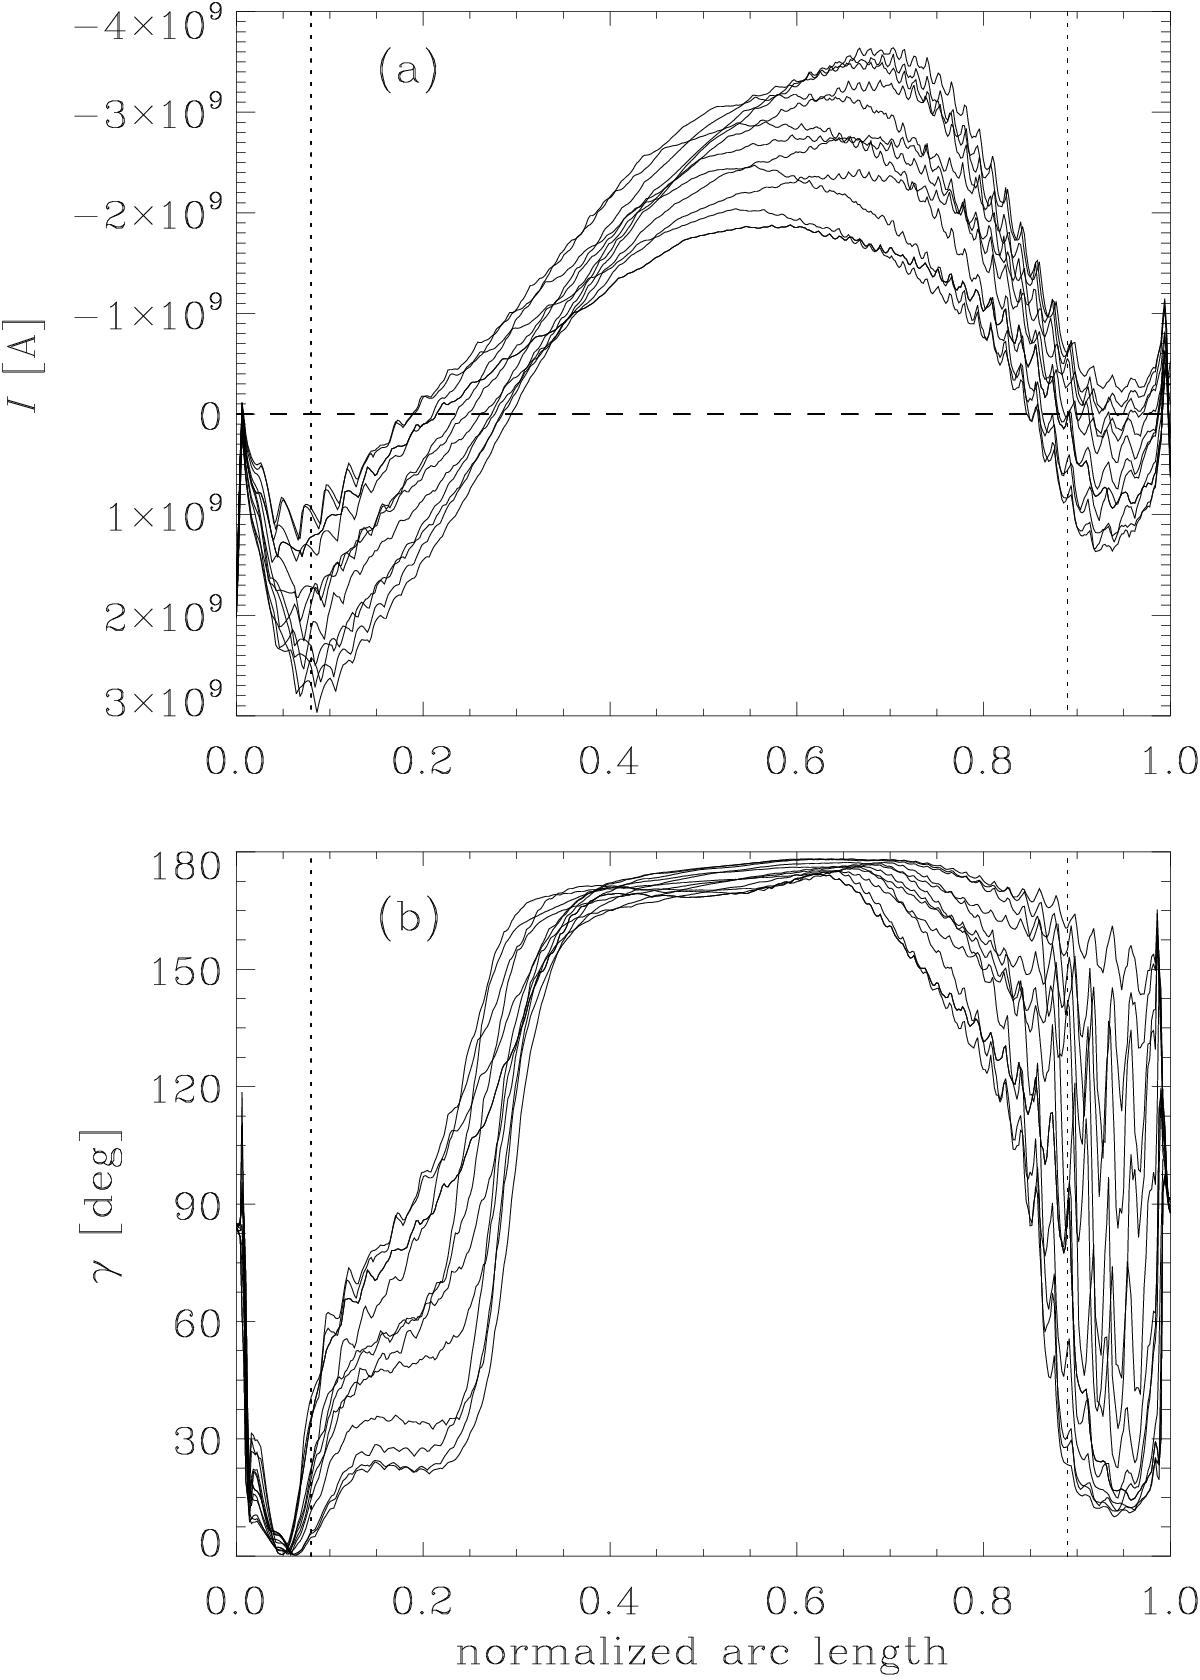
Current properties along a loop in an emerging active region of Chen et al. (2014, 2015). The format is the same as for the loop in the stable active region in Fig. 1. Panel a shows the total current I along the loop that now changes sign and panel b displays the angle γ between current and magnetic field. Just as in Fig. 1 we show I and γ for twelve selected field lines in the loop (cf. Fig. 2) over the normalized arc length. Zero arc length is at the left footpoint of the loop (see Fig. 4). The two vertical dotted lines indicate the coronal region (above 1 MK) and the dashed line indicates zero current. We refer to Sect. 3.1.
Current usage metrics show cumulative count of Article Views (full-text article views including HTML views, PDF and ePub downloads, according to the available data) and Abstracts Views on Vision4Press platform.
Data correspond to usage on the plateform after 2015. The current usage metrics is available 48-96 hours after online publication and is updated daily on week days.
Initial download of the metrics may take a while.