Fig. 2
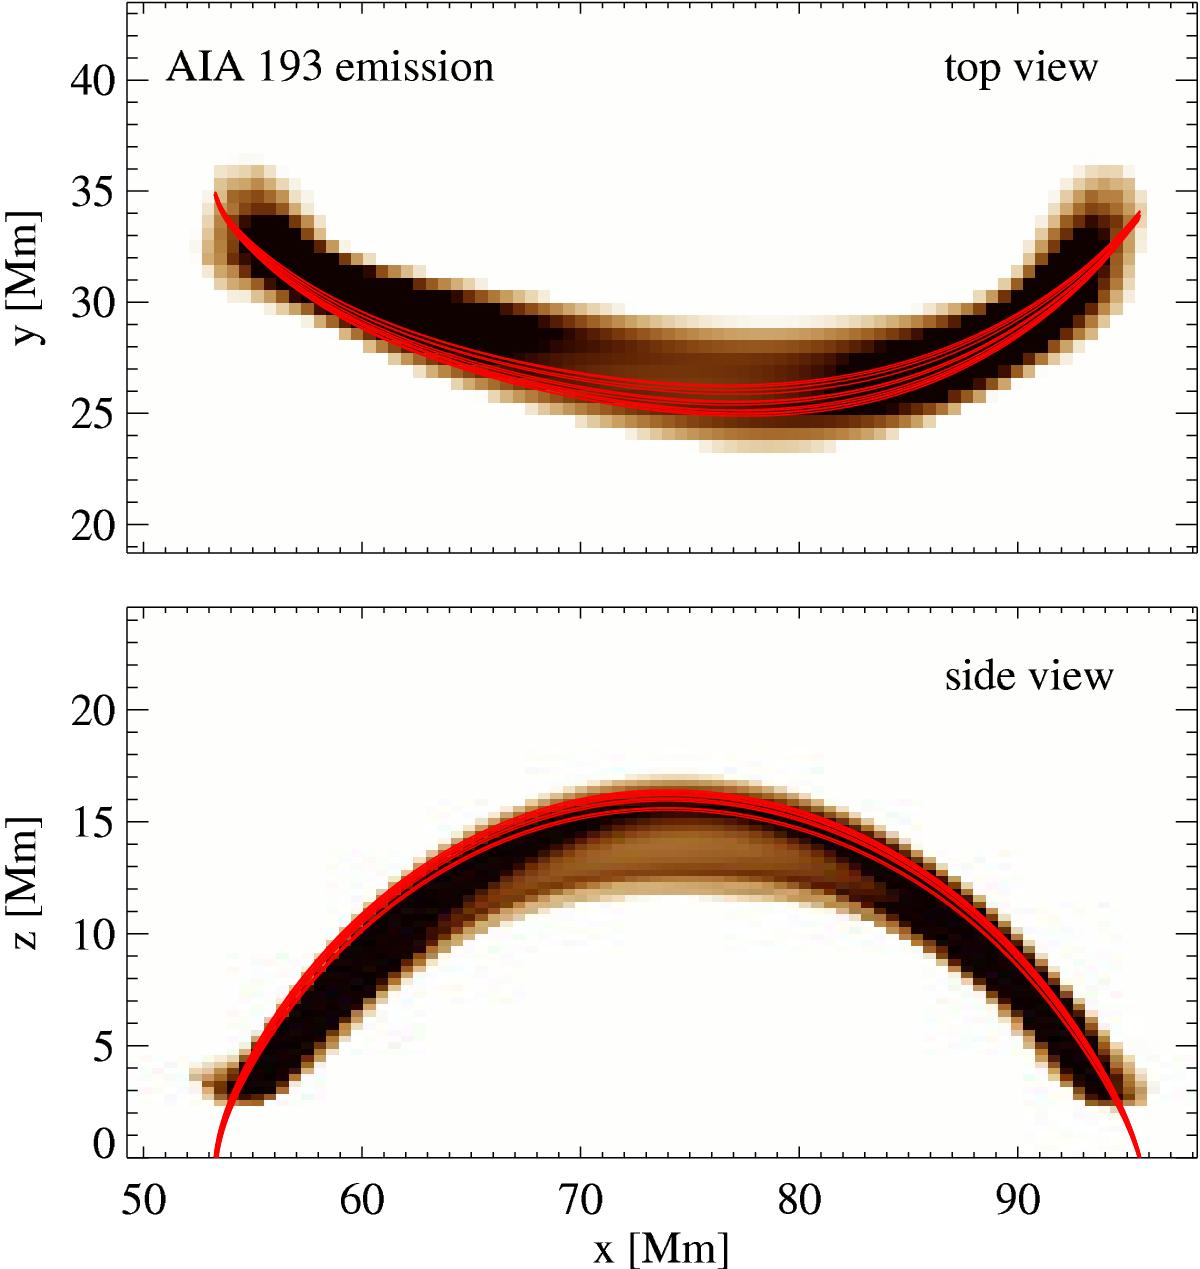
Snapshot of coronal loop and field lines studied here. The background image shows the synthesized EUV emission as it would be seen in the 193 Å channel of AIA showing mainly 1.5 MK hot plasma. Overplotted are twelve selected magnetic field lines (red) within the EUV loop. This shows a snapshot at time t = 12.5 min based on the data from the model by Chen et al. (2014, 2015). The two panels show a view from straight above (top panel) and the side (bottom panel) of part of the computational domain; we refer to Sect. 2.
Current usage metrics show cumulative count of Article Views (full-text article views including HTML views, PDF and ePub downloads, according to the available data) and Abstracts Views on Vision4Press platform.
Data correspond to usage on the plateform after 2015. The current usage metrics is available 48-96 hours after online publication and is updated daily on week days.
Initial download of the metrics may take a while.