Fig. 1
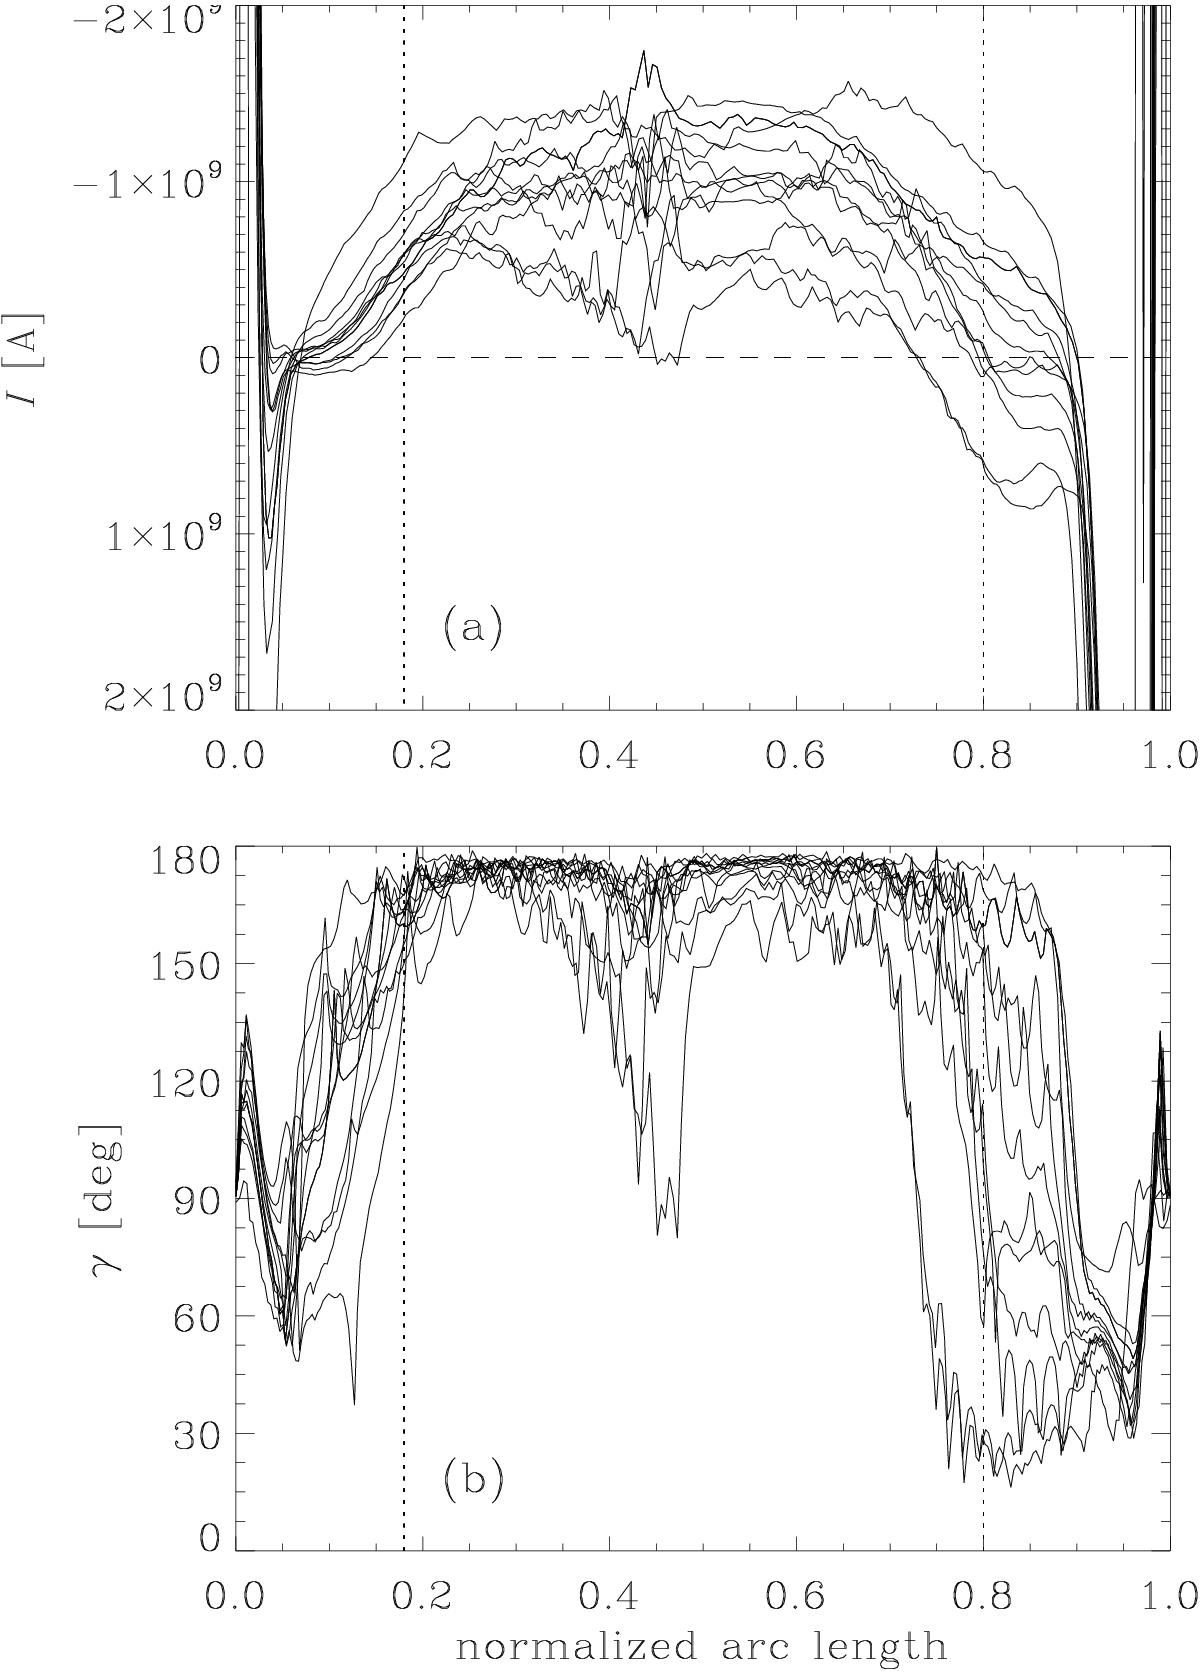
Testing the force-freeness in a 3D MHD model of a stable active region. Panel a: total current, I, along the magnetic field, B, where I is integrated over the cross-section of the expanding flux tube. Panel b: displays the angle γ between the current density, J, and B. Both I and γ are plotted for twelve selected field lines in an EUV loop over the normalized arc length (i.e., 0 and 1 are in the photosphere and the apex is at about 0.5). I and γ are defined in Eqs. (1) and (2), respectively. The hot coronal part of the loop (with temperatures above 1 MK) is found between the vertical dotted lines. Based on data from Bingert & Peter (2011). See Sect. 1.
Current usage metrics show cumulative count of Article Views (full-text article views including HTML views, PDF and ePub downloads, according to the available data) and Abstracts Views on Vision4Press platform.
Data correspond to usage on the plateform after 2015. The current usage metrics is available 48-96 hours after online publication and is updated daily on week days.
Initial download of the metrics may take a while.