Fig. 6
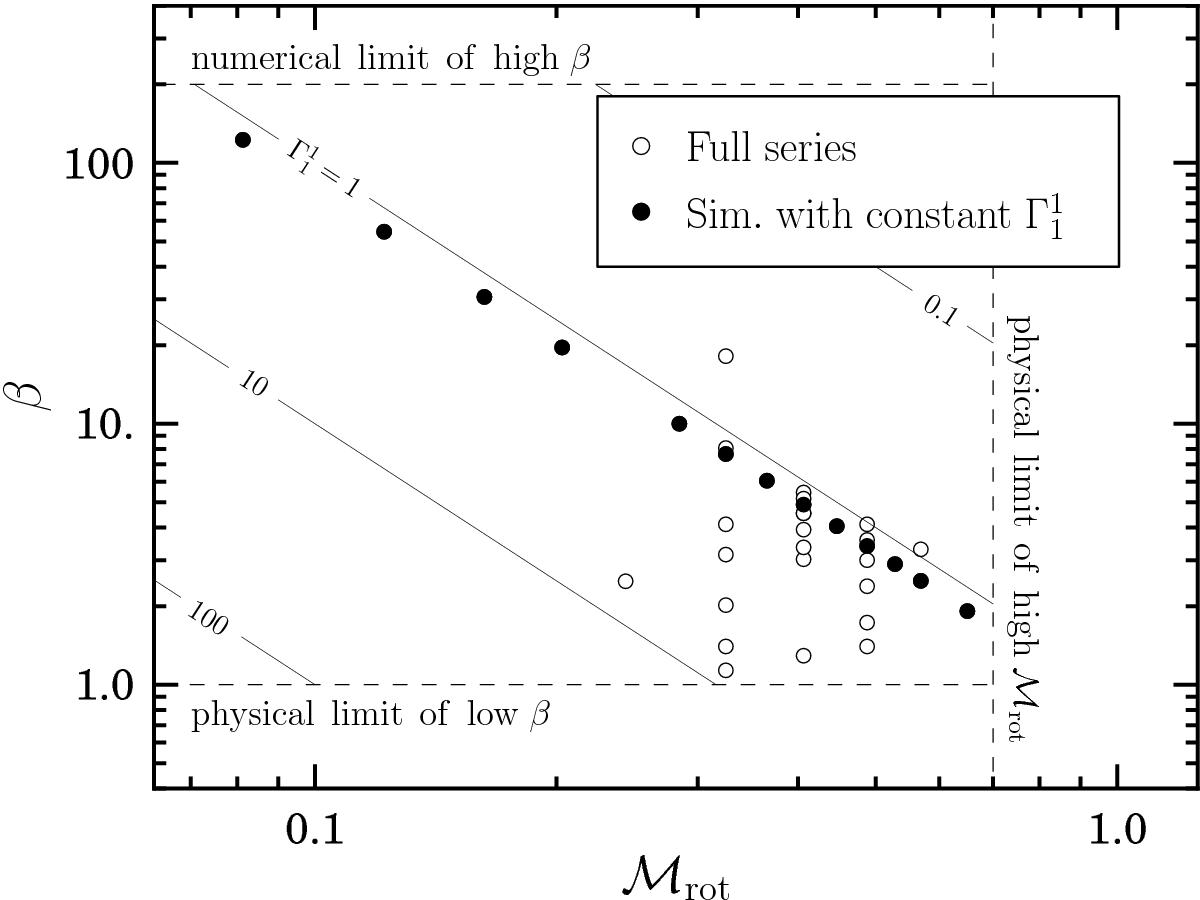
Parameter space of the 2D series, where each point represents one simulation. The filled symbols represent simulations for which ![]() is a constant. Regions that are unphysical or numerically inaccessible are delimited by the dashed lines. The low-β as well as the high-ℳrot limits are due to physical constraints. The high-β limit is of numerical nature.
is a constant. Regions that are unphysical or numerically inaccessible are delimited by the dashed lines. The low-β as well as the high-ℳrot limits are due to physical constraints. The high-β limit is of numerical nature.
Current usage metrics show cumulative count of Article Views (full-text article views including HTML views, PDF and ePub downloads, according to the available data) and Abstracts Views on Vision4Press platform.
Data correspond to usage on the plateform after 2015. The current usage metrics is available 48-96 hours after online publication and is updated daily on week days.
Initial download of the metrics may take a while.