Fig. 8
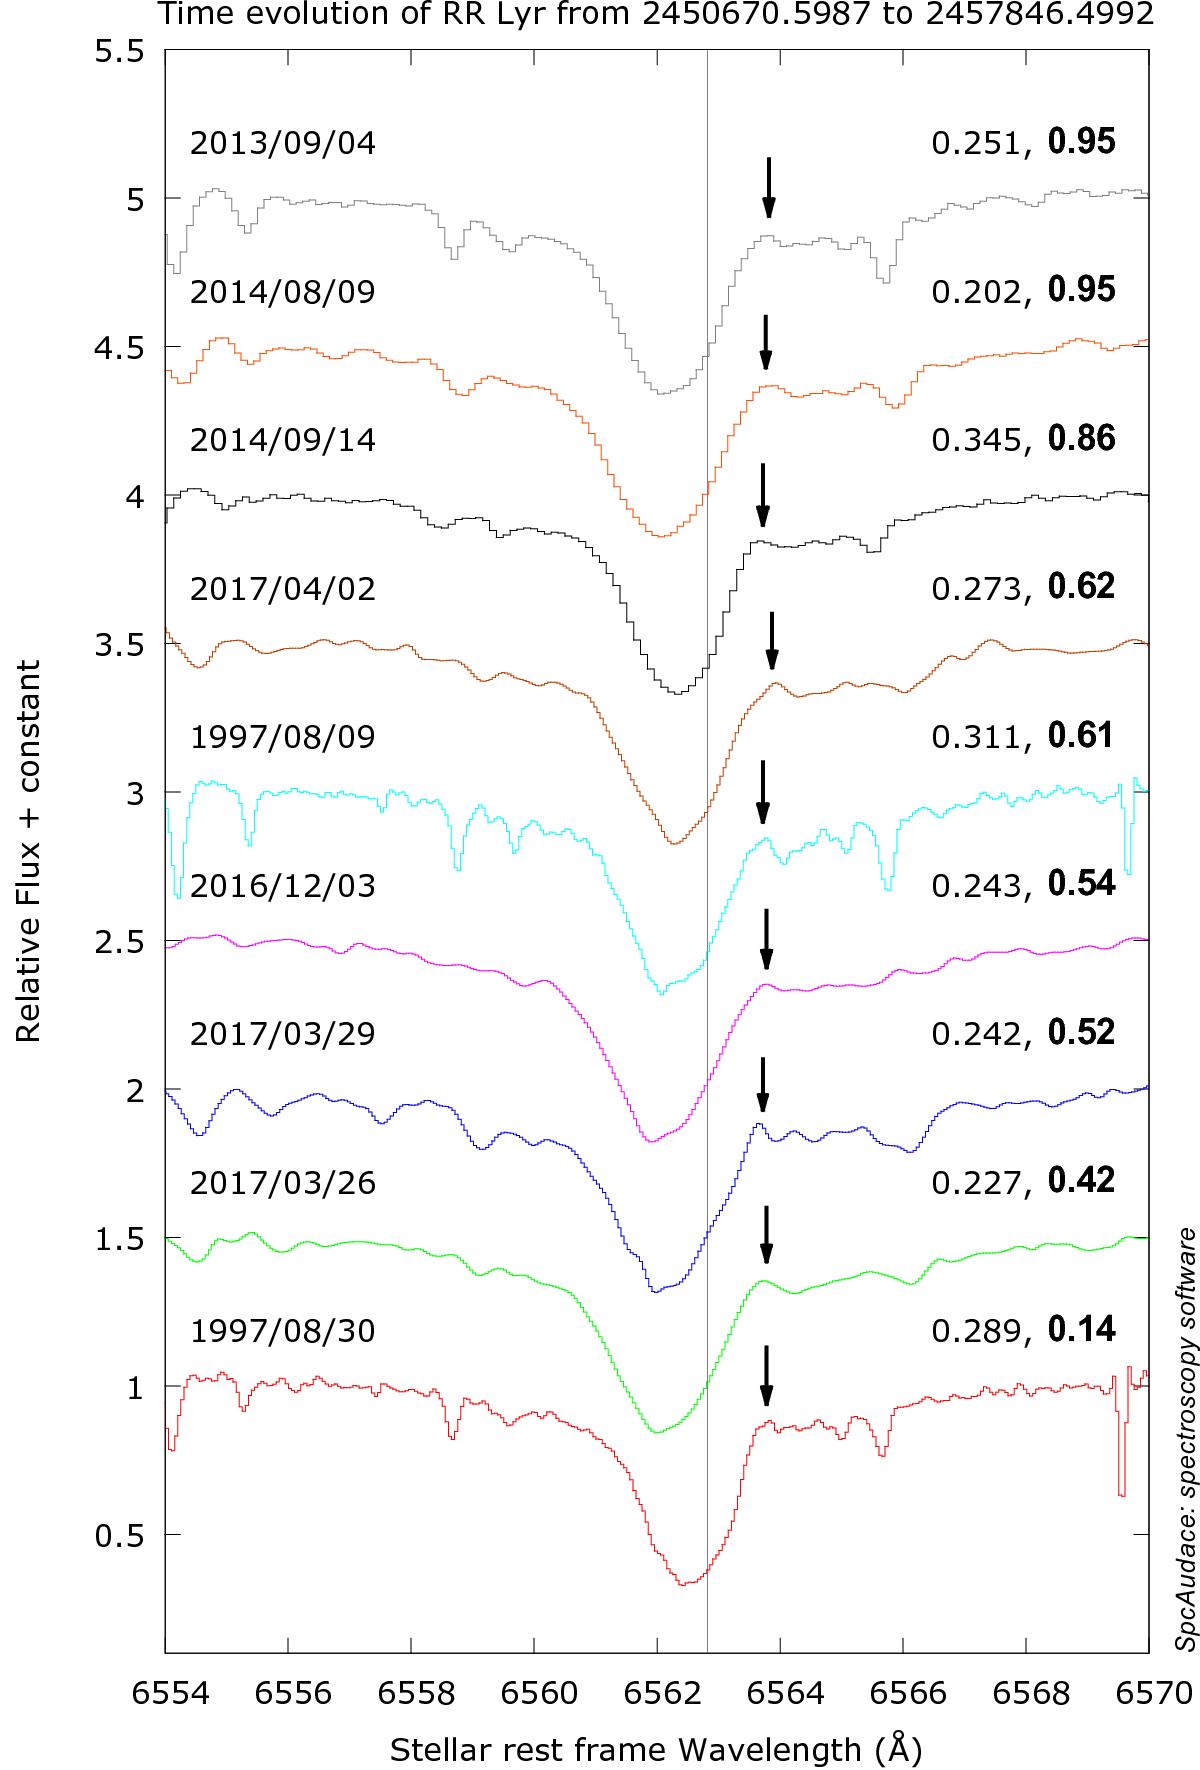
Hα profile of RR Lyr for the 1997 to 2017 observations. Pulsation and Blazhko (in bold) phases (right) and observation dates (left) are indicated. The third emission is present at all Blazhko phases despite the different spectral resolutions and S/N. The detector pixel is shown in each spectrum. The vertical line shows the Hα line laboratory wavelength in the stellar rest frame.
Current usage metrics show cumulative count of Article Views (full-text article views including HTML views, PDF and ePub downloads, according to the available data) and Abstracts Views on Vision4Press platform.
Data correspond to usage on the plateform after 2015. The current usage metrics is available 48-96 hours after online publication and is updated daily on week days.
Initial download of the metrics may take a while.