Fig. 5
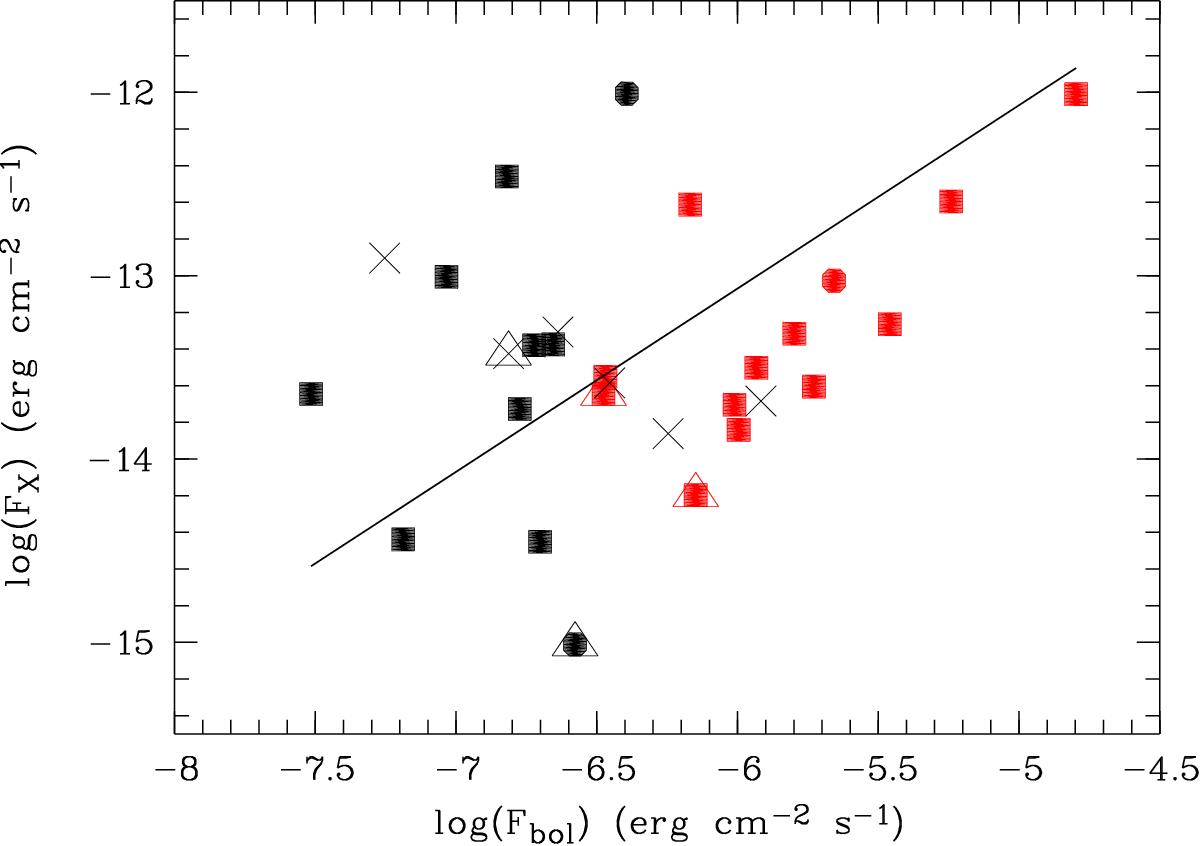
Relation between X-ray and bolometric luminosity. The stars belonging to NGC 6357 and NGC 6334 are indicated by squares and circles, respectively. The O and B stars are coded as red and black symbols. Symbols marked by a triangle are stars with poor spectra, while crosses indicate stars with distances greater than 3 kpc or less than 1.1 kpc. The X-ray fluxes are evaluated in the [0.5–8 keV] energy band and corrected for interstellar extinction. The line corresponds to the scaling relation log(LX/Lbol) = −7.07.
Current usage metrics show cumulative count of Article Views (full-text article views including HTML views, PDF and ePub downloads, according to the available data) and Abstracts Views on Vision4Press platform.
Data correspond to usage on the plateform after 2015. The current usage metrics is available 48-96 hours after online publication and is updated daily on week days.
Initial download of the metrics may take a while.