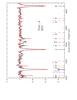
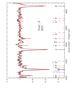
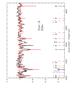
Fig. B.1
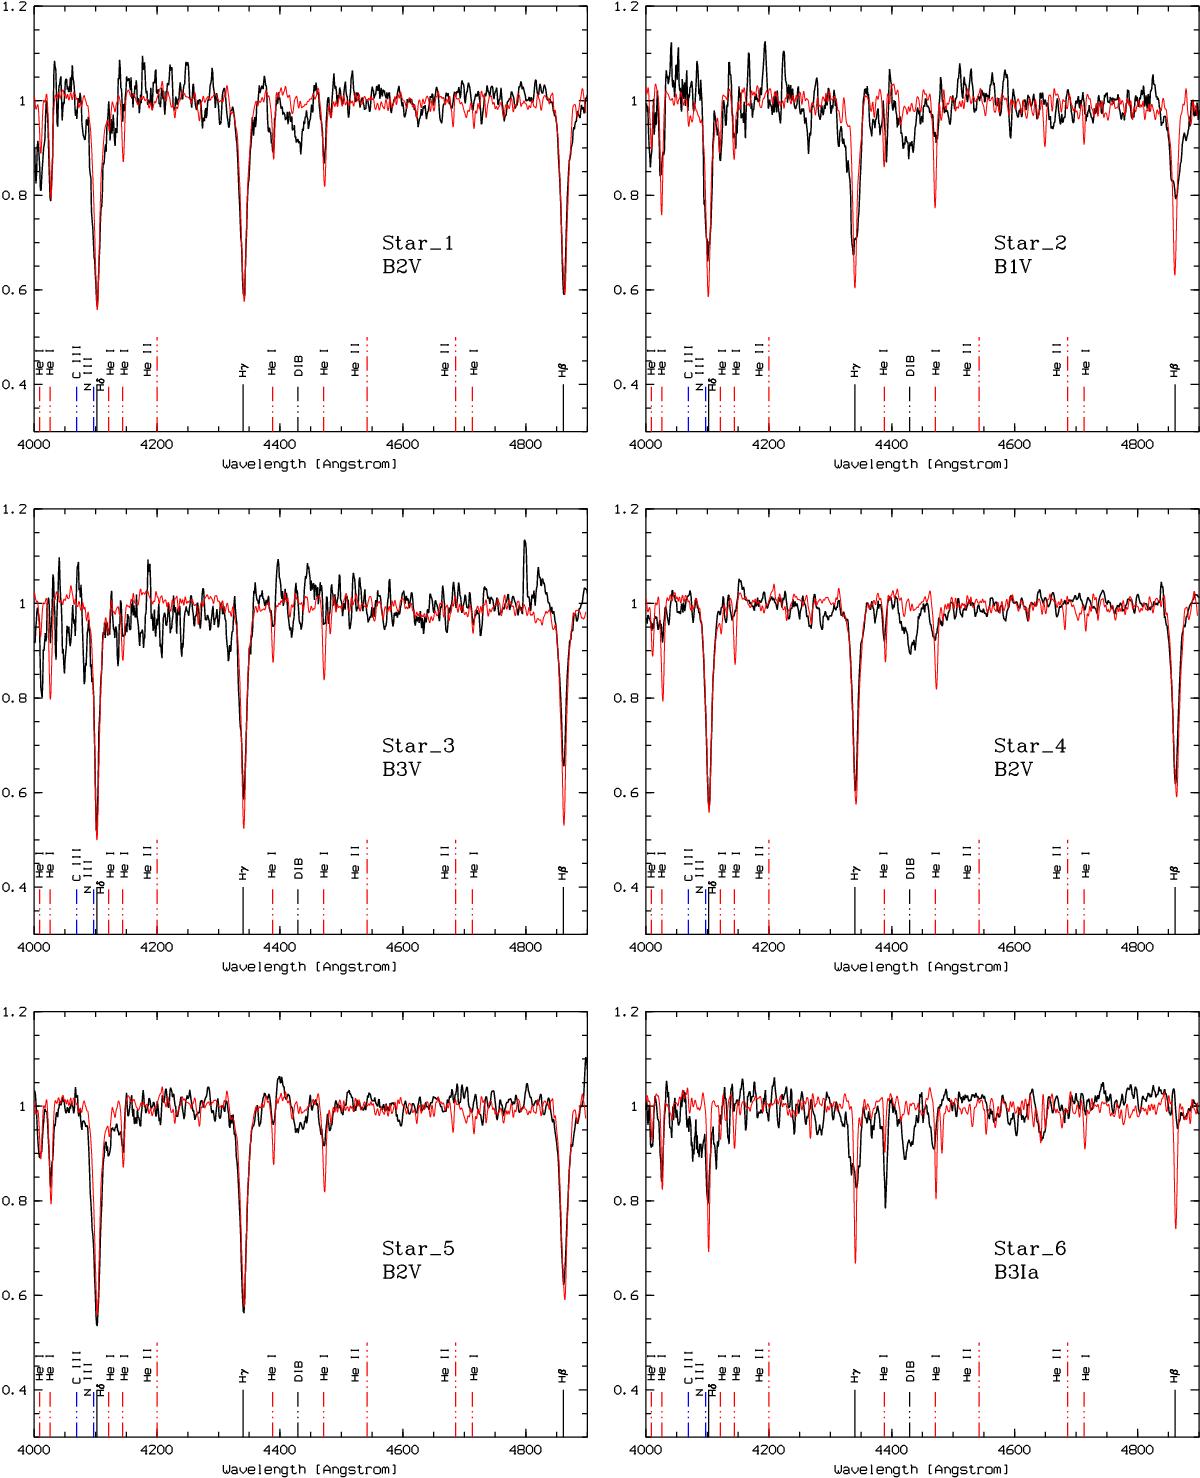
Normalised spectra (black curves) of our OB star sample. Tickmarks indicate the expected position of the hydrogen lines (black solid), the diffuse insterstellar absorption band (black dash-dot-dot), the helium I (red dash-dot-dot) and helium II (long red dash-dot-dot) lines, and the CIII-4069 and NIII-4097 lines (blue dash-dot-dot). The red plot is the template corresponding to the indicated spectral type.
Current usage metrics show cumulative count of Article Views (full-text article views including HTML views, PDF and ePub downloads, according to the available data) and Abstracts Views on Vision4Press platform.
Data correspond to usage on the plateform after 2015. The current usage metrics is available 48-96 hours after online publication and is updated daily on week days.
Initial download of the metrics may take a while.