Fig. 5
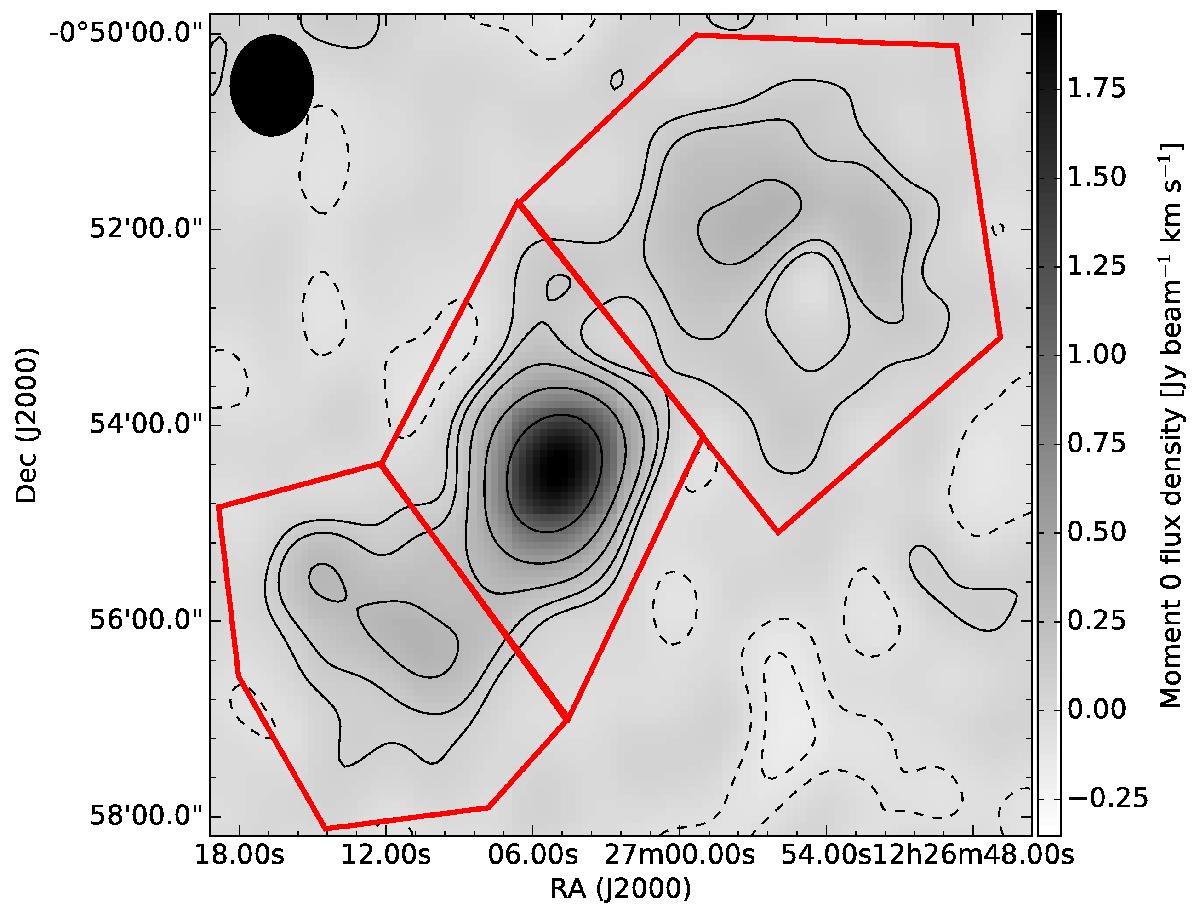
Moment-0 map of HI after correcting for the absorption towards NGC 4418, as described in Sect. 3.4. More emission is seen close to NGC 4418 than in Fig. 1b. The red polygons mark three regions where pixels were summed to measure the flux values listed in Table 2. Both greyscale and contours show the moment-0 map, with the same contours as in Fig. 1b.
Current usage metrics show cumulative count of Article Views (full-text article views including HTML views, PDF and ePub downloads, according to the available data) and Abstracts Views on Vision4Press platform.
Data correspond to usage on the plateform after 2015. The current usage metrics is available 48-96 hours after online publication and is updated daily on week days.
Initial download of the metrics may take a while.