Fig. 3
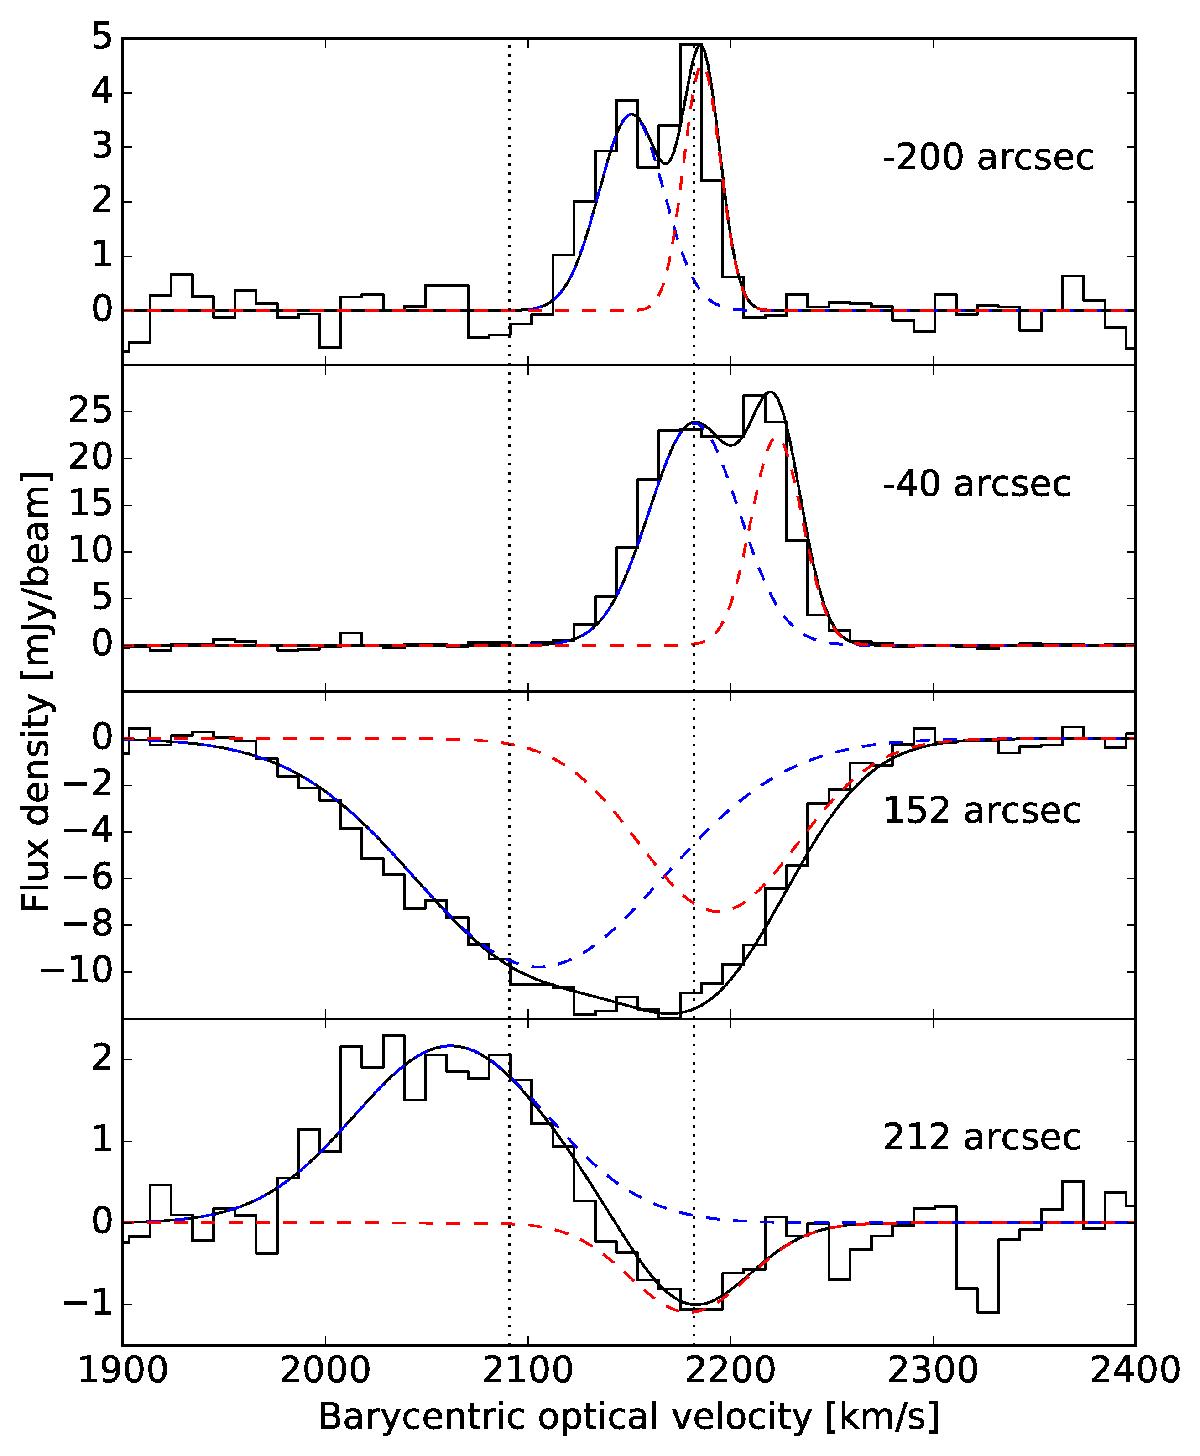
Spectra extracted towards the four directions defined in Fig. 2b. The dashed curves show the fitted Gaussian components listed in Table 1. The solid line in each panel represents the sum of the fitted components, which are to be compared with the observed spectra in black steps. The vertical dotted lines show the velocities for the two components fitted to CO(2-1) by Costagliola et al. (2013). For reference, the systemic velocity of NGC 4418 has been measured as 2088 km s-1 by Sakamoto et al. (2013).
Current usage metrics show cumulative count of Article Views (full-text article views including HTML views, PDF and ePub downloads, according to the available data) and Abstracts Views on Vision4Press platform.
Data correspond to usage on the plateform after 2015. The current usage metrics is available 48-96 hours after online publication and is updated daily on week days.
Initial download of the metrics may take a while.