Fig. 2
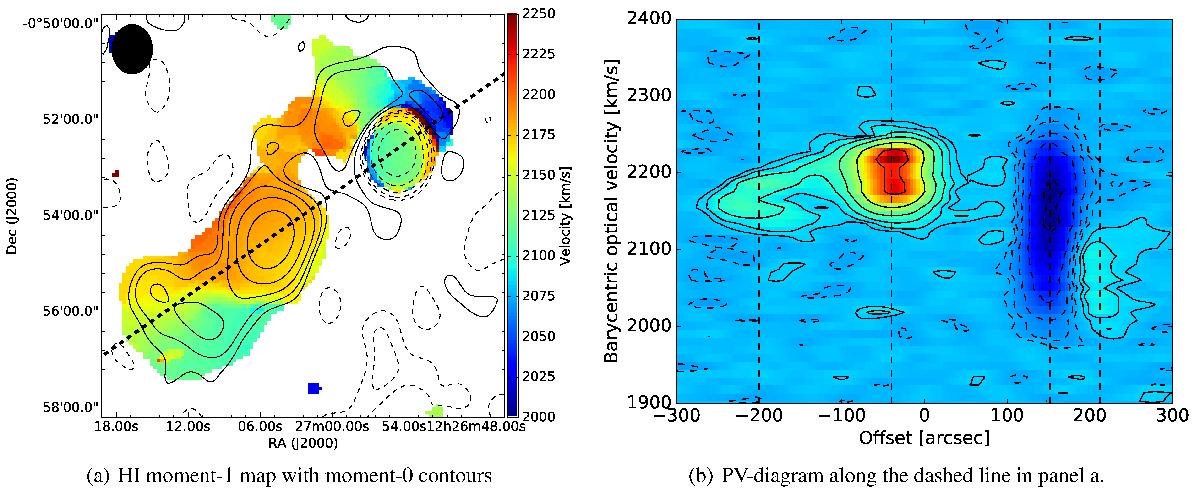
Panel a: moment-1 HI map in colour with the moment-0 contours from Fig. 1b in black. The CLEAN beam is displayed as a black ellipse in the top left corner. Panel b: position-velocity diagram extracted along the dashed line in panel a; an 11.3′ slice from RA ![]() Dec −00°57′19.85′′ to RA
Dec −00°57′19.85′′ to RA ![]() Dec −00°50′48.73′′, that is, passing through both NGC 4418 and VV 655. Four distinct features can be seen along the slice at the approximate relative offset values of −200′′, −40′′ (VV 655), 152′′ (NGC 4418; in absorption), and 212′′. Spectra extracted at these positions, that is, the dashed lines in panel b, are presented in Fig. 3. Contours in panel b are ±[0.025,0.05,0.1,0.2,0.4,0.8] × 26.7 mJy/beam (the peak).
Dec −00°50′48.73′′, that is, passing through both NGC 4418 and VV 655. Four distinct features can be seen along the slice at the approximate relative offset values of −200′′, −40′′ (VV 655), 152′′ (NGC 4418; in absorption), and 212′′. Spectra extracted at these positions, that is, the dashed lines in panel b, are presented in Fig. 3. Contours in panel b are ±[0.025,0.05,0.1,0.2,0.4,0.8] × 26.7 mJy/beam (the peak).
Current usage metrics show cumulative count of Article Views (full-text article views including HTML views, PDF and ePub downloads, according to the available data) and Abstracts Views on Vision4Press platform.
Data correspond to usage on the plateform after 2015. The current usage metrics is available 48-96 hours after online publication and is updated daily on week days.
Initial download of the metrics may take a while.