Fig. 8
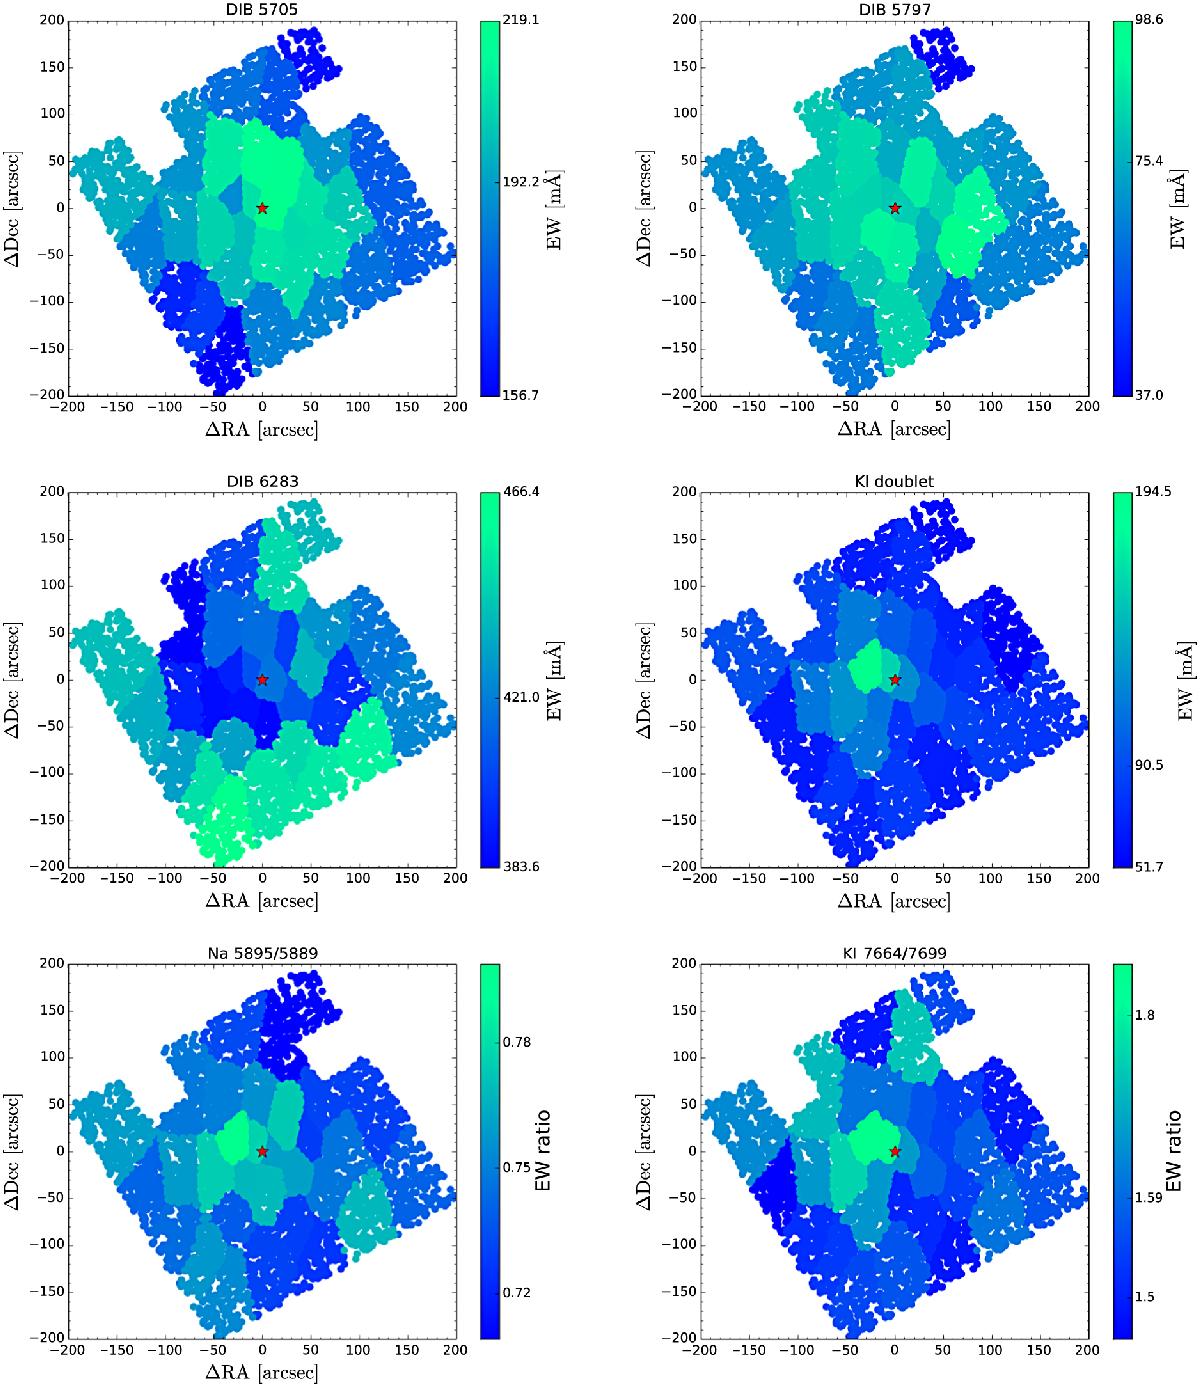
Top: equivalent width maps with DIBs 5780, 5797; center: DIB 6283 and K I ; bottom: maps of doublet line ratios for Na I D and K I , indicating optical depth. For each map, the ≈10 000 selected spectra were combined into 31 Voronoi bins. The color bar shows the equivalent width range as well as the average value for the species. The uncertainty is in the order of 8 mÅ.
Current usage metrics show cumulative count of Article Views (full-text article views including HTML views, PDF and ePub downloads, according to the available data) and Abstracts Views on Vision4Press platform.
Data correspond to usage on the plateform after 2015. The current usage metrics is available 48-96 hours after online publication and is updated daily on week days.
Initial download of the metrics may take a while.