Fig. 3
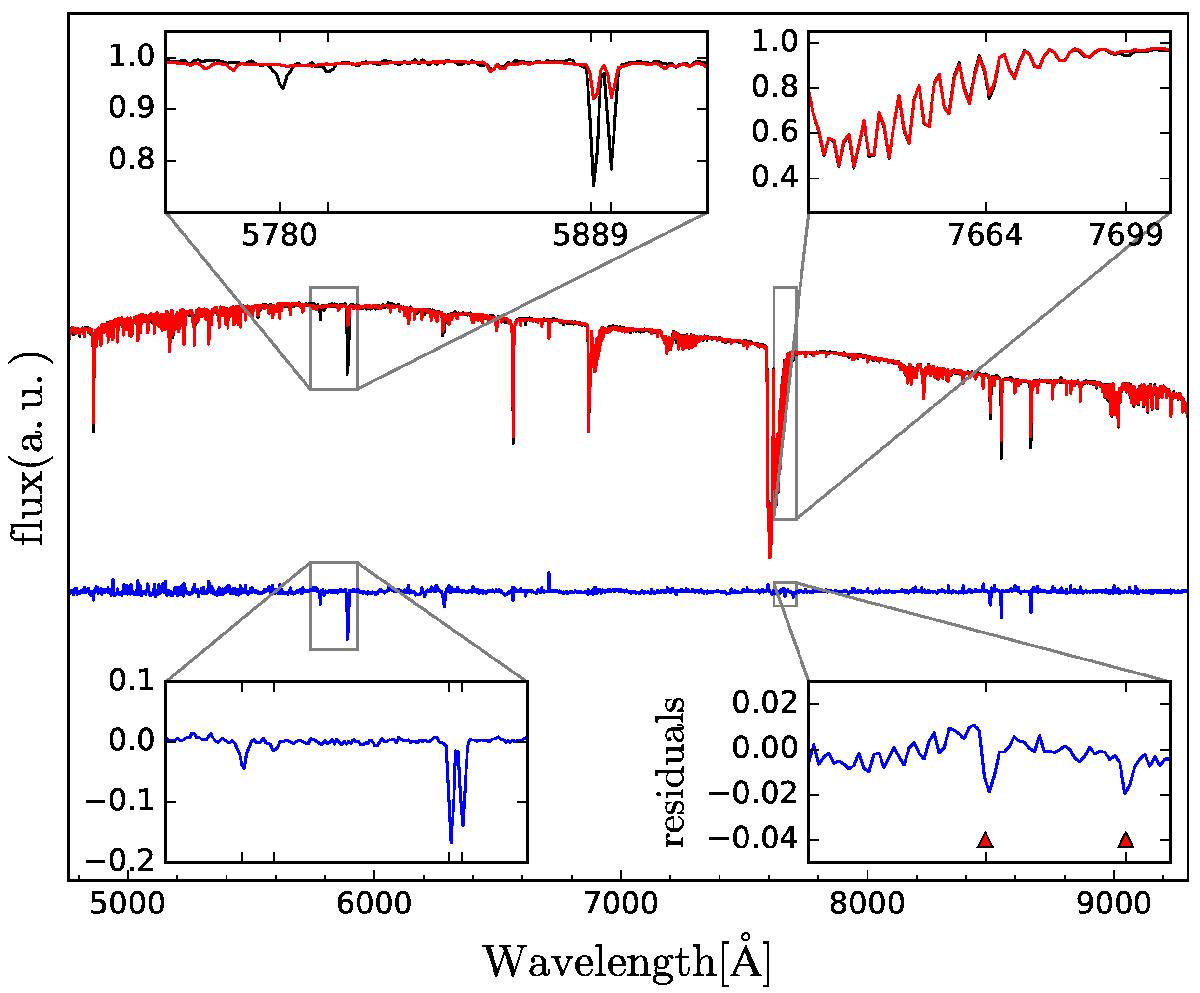
Steps of data processing. In black the data for one of the brightest stars in the field with a S/N ~ 120. In red the best fit to the data including the telluric absorption line fit as well. In blue below the fitting residuals to scale with the plotted spectrum. The enlargement windows to the left, highlight the region around the DIBs 5780, 5797 and the Na I D doublet. On the right hand side, the zoom illustrates the success of the telluric absorption line fit. We note that the zoom into the fitting residuals for this region is scaled by a factor of 10. For this example based on a single star of particularly high S/N, the K I doublet stands out even for an individual stellar fit (red triangles).
Current usage metrics show cumulative count of Article Views (full-text article views including HTML views, PDF and ePub downloads, according to the available data) and Abstracts Views on Vision4Press platform.
Data correspond to usage on the plateform after 2015. The current usage metrics is available 48-96 hours after online publication and is updated daily on week days.
Initial download of the metrics may take a while.