Free Access
Fig. A.1
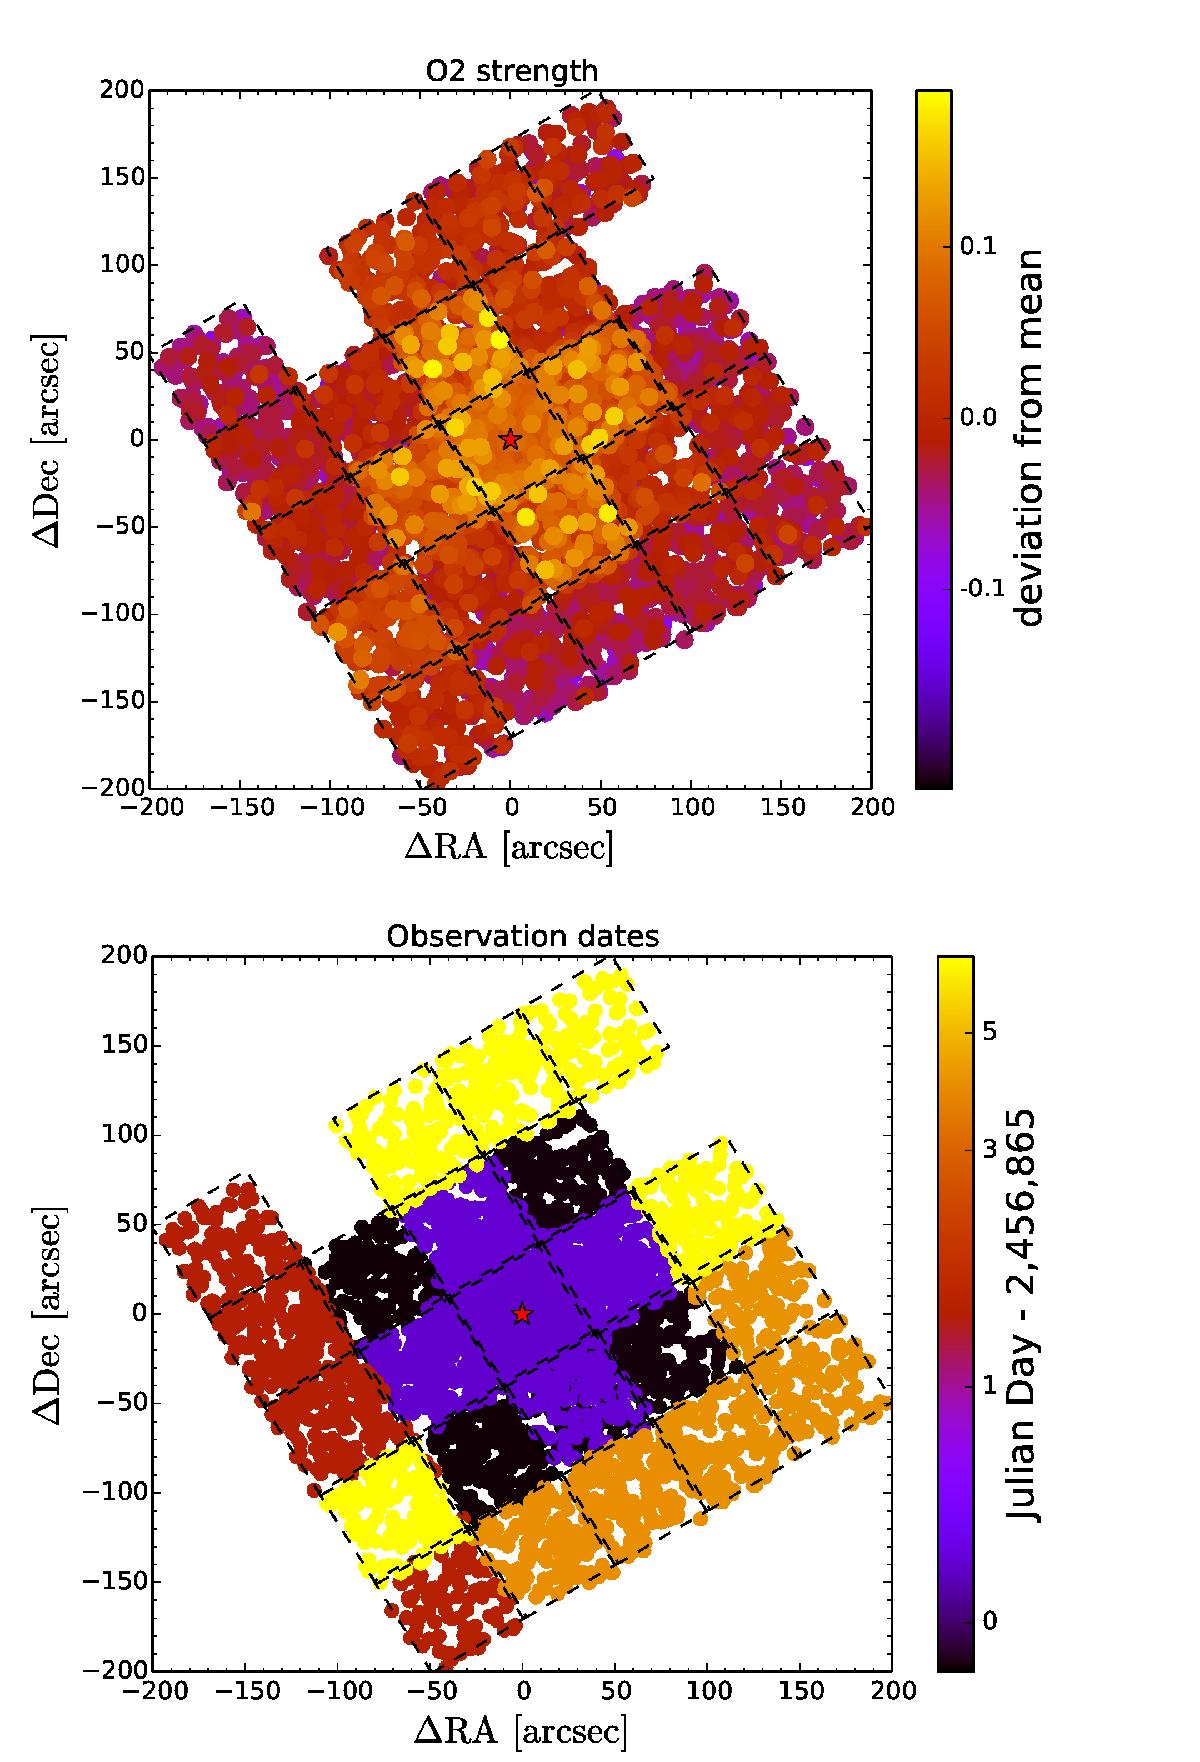
Top: strengths of O2 in the sky model per individual star with a S/N above 20. Bottom: the day of observation relative to JD 2 456 865. The separate pointings are framed in black dashed lines. We note, that several pointings overlap and only the latest visually contributes to this plot.
This figure is made of several images, please see below:
Current usage metrics show cumulative count of Article Views (full-text article views including HTML views, PDF and ePub downloads, according to the available data) and Abstracts Views on Vision4Press platform.
Data correspond to usage on the plateform after 2015. The current usage metrics is available 48-96 hours after online publication and is updated daily on week days.
Initial download of the metrics may take a while.