Free Access
Fig. 13
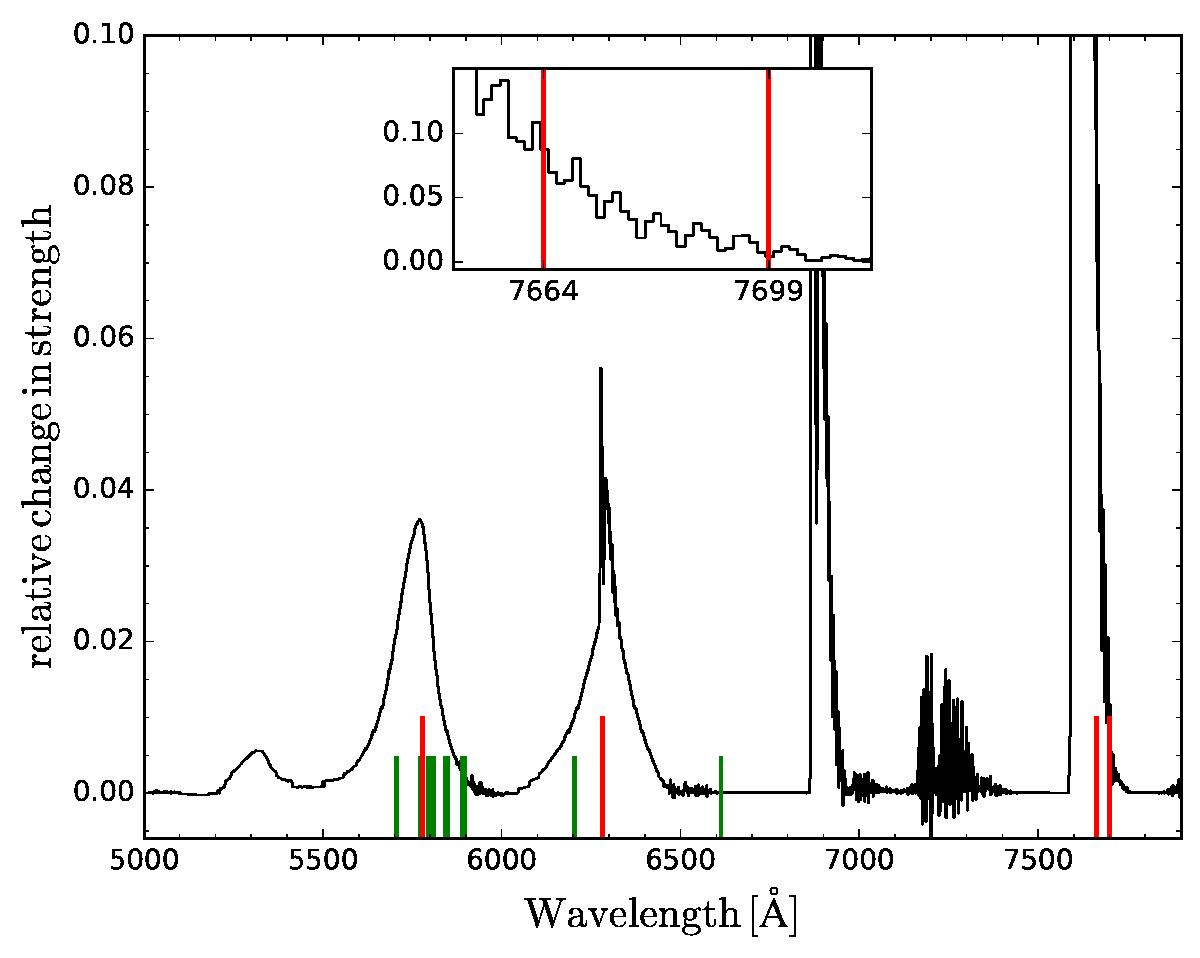
Maximum difference in modeled O2 absorption relative to the total mean of all exposures. Positions of observed DIBs indicated in green. The red lines mark DIB 5780, DIB 6283 and the K I doublet at 7664, 7699 Å, which is also shown in the inset at the top.
Current usage metrics show cumulative count of Article Views (full-text article views including HTML views, PDF and ePub downloads, according to the available data) and Abstracts Views on Vision4Press platform.
Data correspond to usage on the plateform after 2015. The current usage metrics is available 48-96 hours after online publication and is updated daily on week days.
Initial download of the metrics may take a while.