Fig. 1
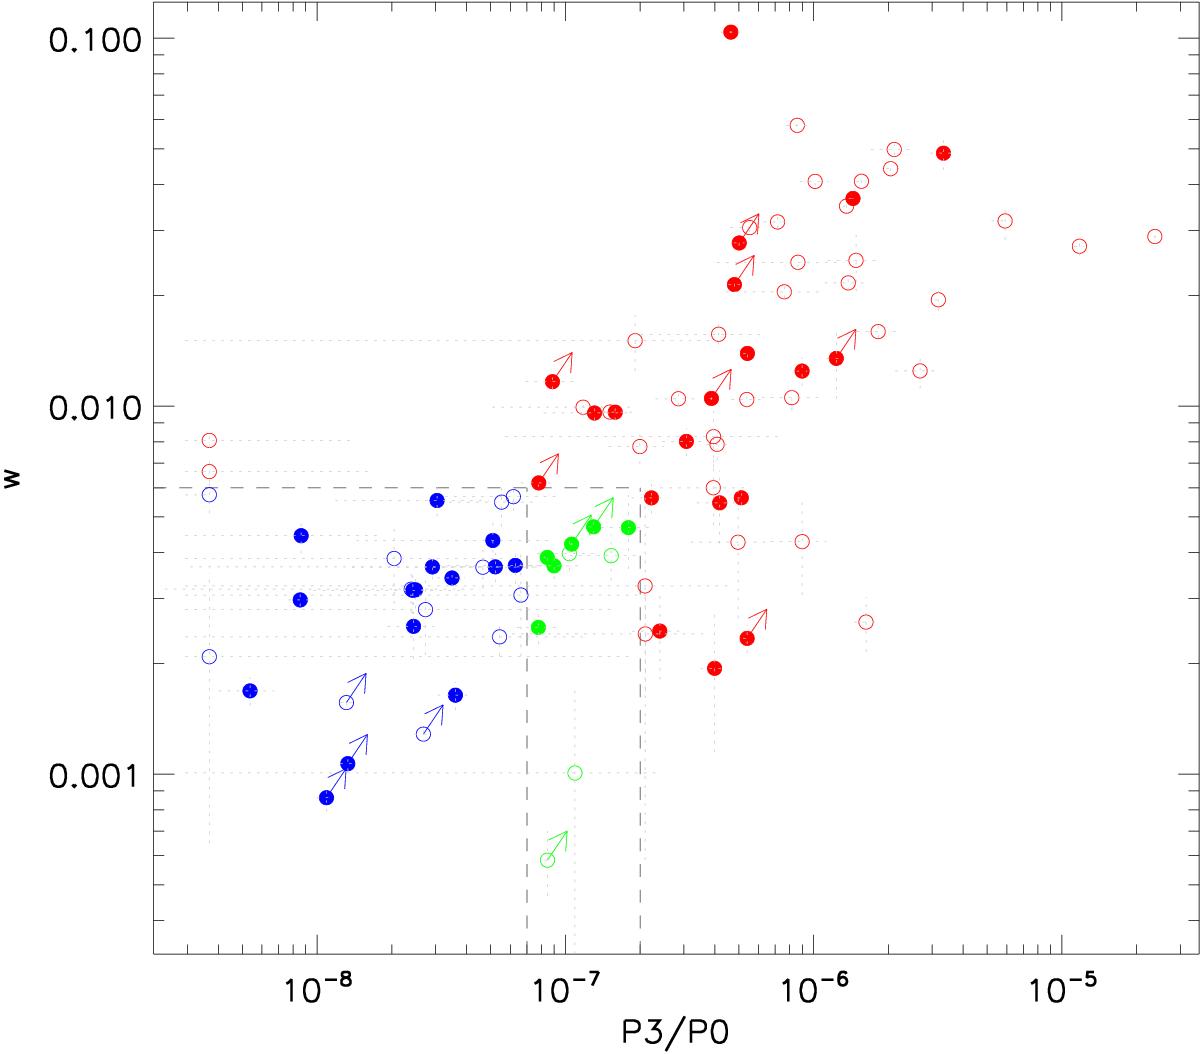
Structural parameters, w vs. P3, for the distributions of the disturbed (red), intermediate (green), and relaxed (blue) clusters. Solid circles are the clusters that also belong to FLS1 above a flux limit of 10-11 erg s-1 cm-2. For the clusters whose r500 is not covered by the XMM-Newton observations, the measured values are lower limits, as indicated by upward arrows. The three morphological classifications are based on the three dashed lines.
Current usage metrics show cumulative count of Article Views (full-text article views including HTML views, PDF and ePub downloads, according to the available data) and Abstracts Views on Vision4Press platform.
Data correspond to usage on the plateform after 2015. The current usage metrics is available 48-96 hours after online publication and is updated daily on week days.
Initial download of the metrics may take a while.