Fig. 1
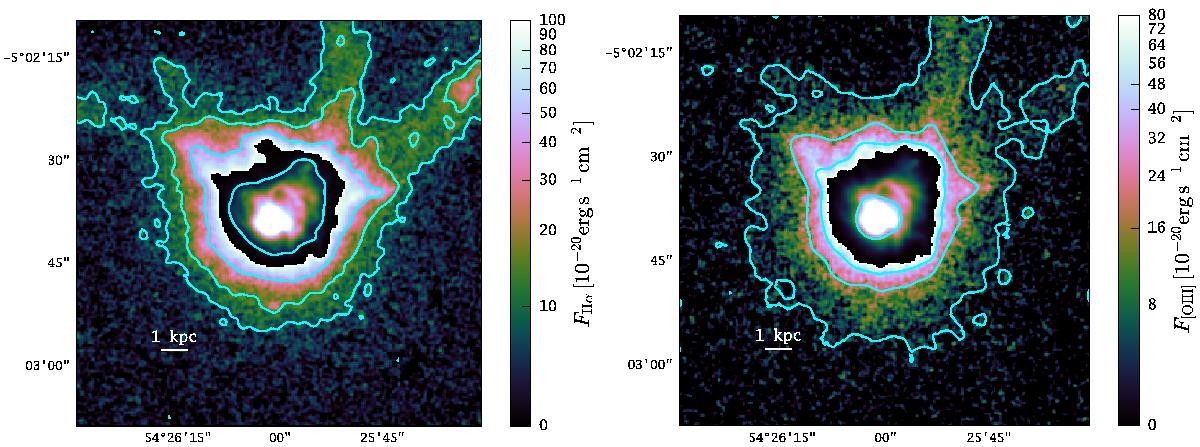
Hα (left) and [O iii] λ5007 (right) narrowband images of SBS 0335-052E created from the MUSE data cube. East is left and north is up. The colour scale within the high-SB region encodes fluxes from 10-18 to 10-15 erg s-1 cm-2 for Hα and 8 × 10-19 to 8 × 10-16 erg s-1 cm-2 for [O iii], while for the outer low surface-brightness region the encoding is shown by the colour bar on the right. An asinh scaling is used. SB contours are drawn at [2.5,5,12.5,1250] × 10-18 erg s-1 cm-2 arcsec-2 for Hα and [0.5,5,12.5,1000] × 10-18 erg s-1 cm-2 arcsec-2 for [O iii]. To highlight the low-SB features, the images were smoothed with a σ = 1 px (0.2′′) Gaussian kernel.
Current usage metrics show cumulative count of Article Views (full-text article views including HTML views, PDF and ePub downloads, according to the available data) and Abstracts Views on Vision4Press platform.
Data correspond to usage on the plateform after 2015. The current usage metrics is available 48-96 hours after online publication and is updated daily on week days.
Initial download of the metrics may take a while.