Fig. 3
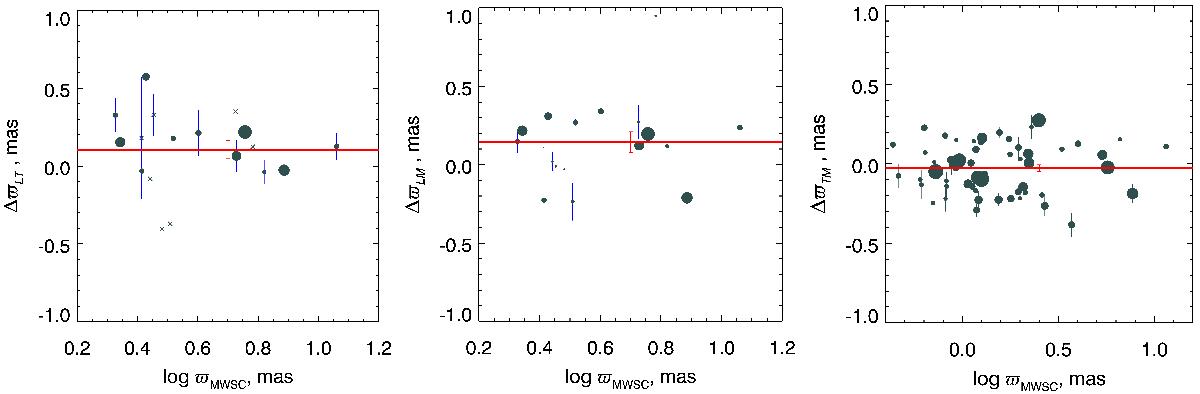
Differences in parallaxes ΔϖLT, ΔϖLM,ΔϖTM (from left to right) as a function of photometric parallax log ϖMWSC. The size of the circles is proportional to the number of individual parallaxes used for the computation of the averages. Vertical bars represent the mean errors of the differences computed as described in the text. The crosses in the left panel indicate vL2017 clusters with TGAS parallaxes for <17 probable MWSC members. The most distant cluster used in our comparison (data point at left edge in right panel) is the rich young cluster NGC 869 at about 2.3 kpc. The thick red lines indicate the mean differences and their mean errors.
Current usage metrics show cumulative count of Article Views (full-text article views including HTML views, PDF and ePub downloads, according to the available data) and Abstracts Views on Vision4Press platform.
Data correspond to usage on the plateform after 2015. The current usage metrics is available 48-96 hours after online publication and is updated daily on week days.
Initial download of the metrics may take a while.