Fig. 1
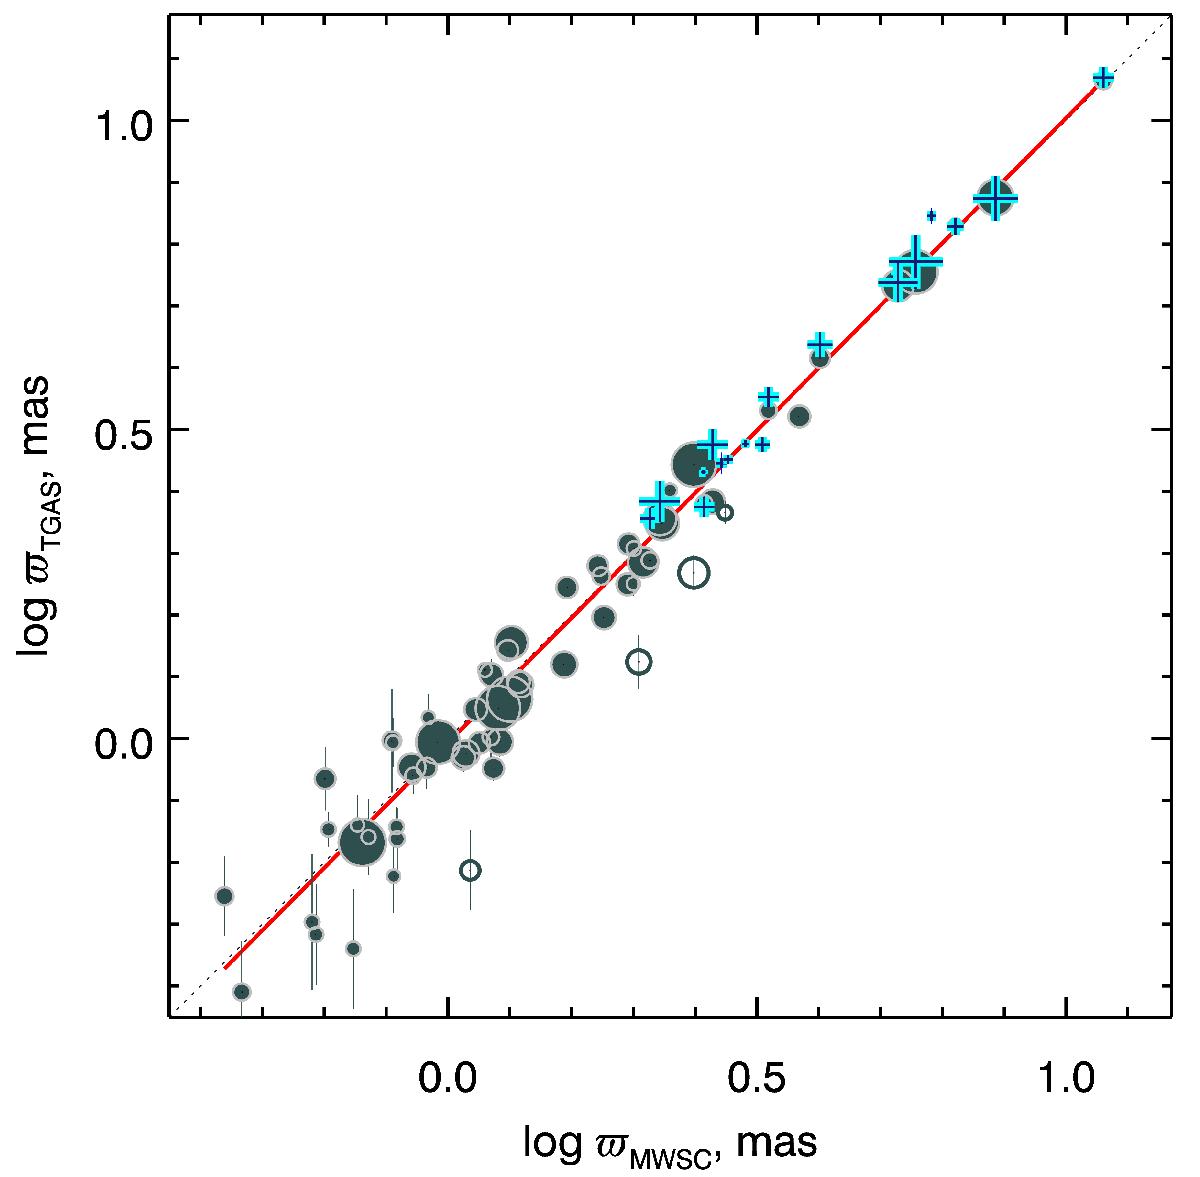
Logarithm of the average trigonometric parallax of clusters log ϖTGAS obtained from individual parallaxes of cluster members vs. logarithm of their photometric parallaxes log ϖMWSC. The sizes of the circles are proportional to the number of TGAS parallaxes available for the calculation of the mean parallax; the vertical bars represent the mean error of the mean. The open circles indicate four discordant clusters discussed in the text. The pluses represent the TGAS parallaxes for selected nearby clusters from vL2017, which are shown here for comparison. The red line indicates a linear regression computed. The dotted line indicates the bisector.
Current usage metrics show cumulative count of Article Views (full-text article views including HTML views, PDF and ePub downloads, according to the available data) and Abstracts Views on Vision4Press platform.
Data correspond to usage on the plateform after 2015. The current usage metrics is available 48-96 hours after online publication and is updated daily on week days.
Initial download of the metrics may take a while.