Fig. 1
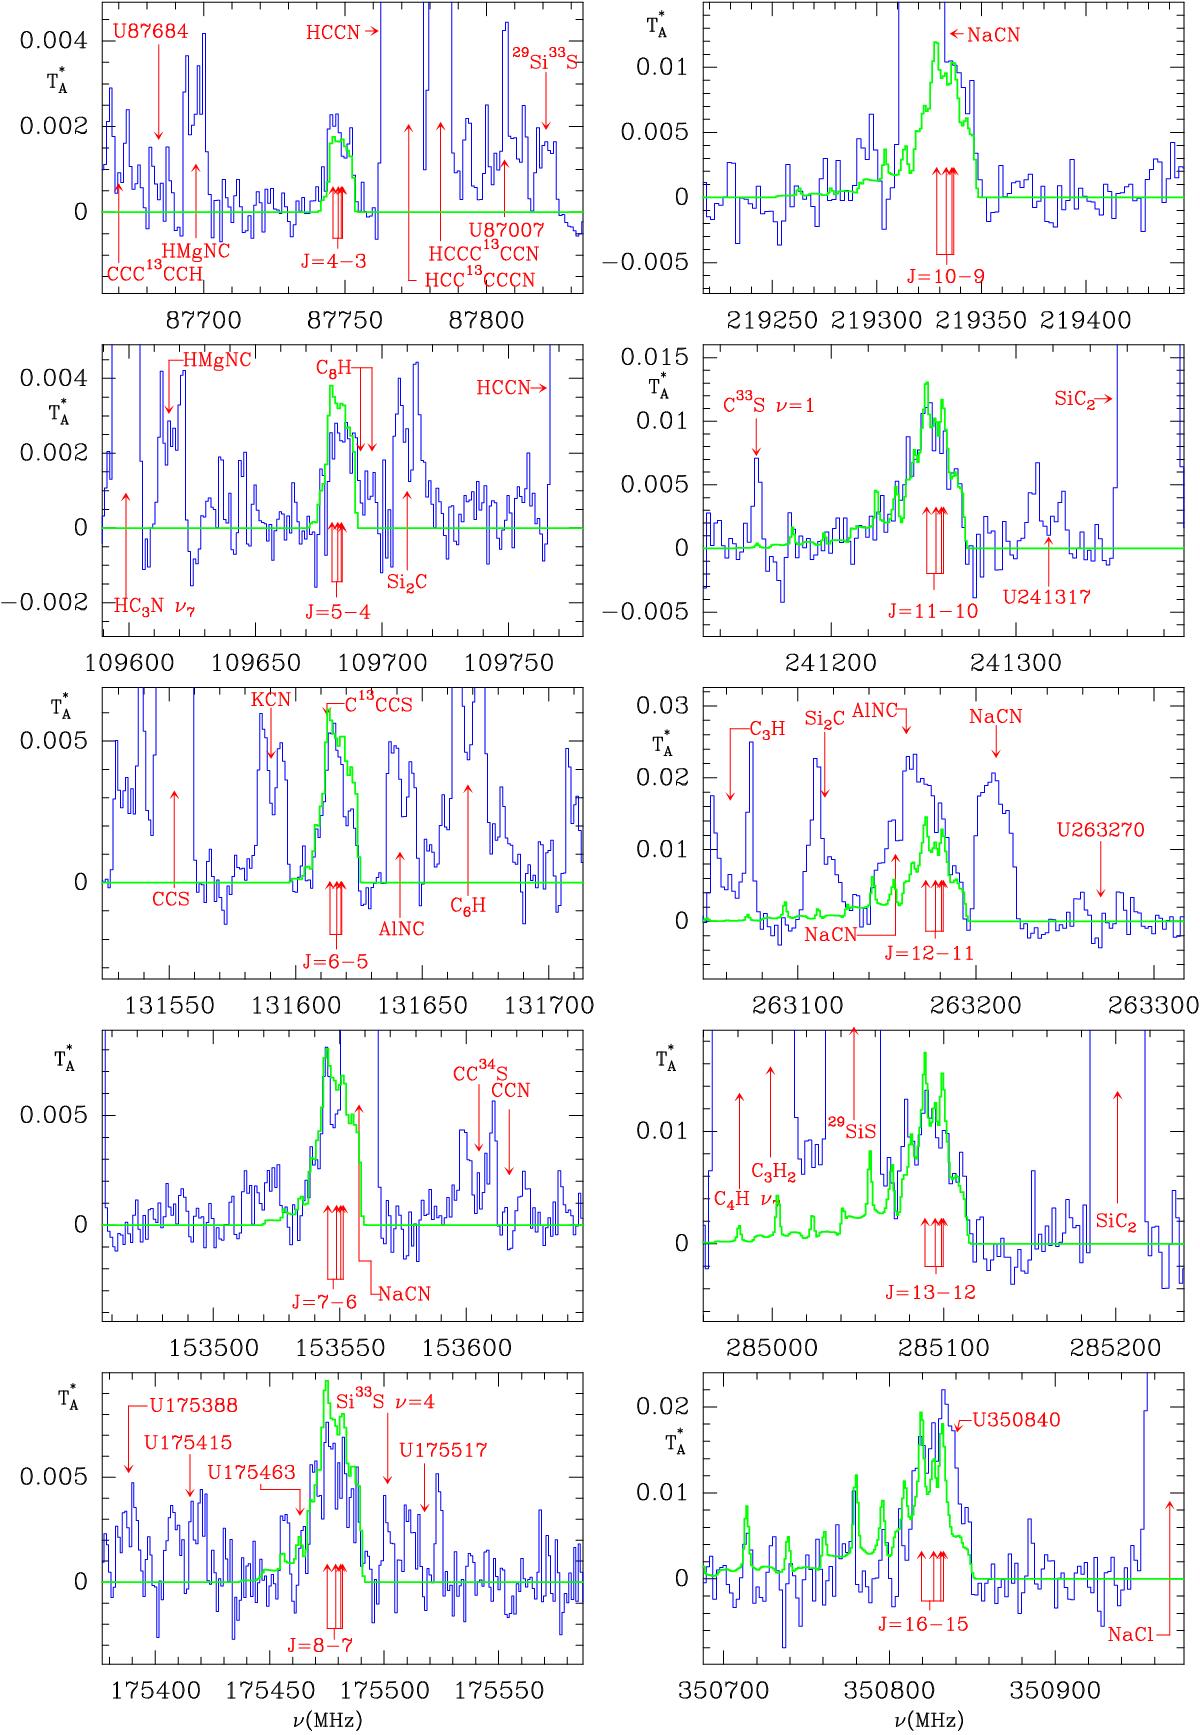
Observed rotational lines of methyl silane, CH3SiH3, towards IRC+10216 in antenna temperature (in K). The spectral resolution is 1 MHz for lines below 200 GHz, and 2 MHz above that frequency. Rest frequencies are indicated for an assumed LSR velocity of the source of −26.5 km s-1. The arrows indicate the position of the K = 0, 1, 2, and 3 components of each J → (J−1) rotational transition. In most cases the K = 0 and 1 components appear superposed. The identification of other features found in the spectra is indicated. Some of the CH3SiH3 lines are partially blended, but their red or blue parts are still clearly visible in the spectra. Green lines correspond to the emerging line profiles calculated with the model discussed in the text.
Current usage metrics show cumulative count of Article Views (full-text article views including HTML views, PDF and ePub downloads, according to the available data) and Abstracts Views on Vision4Press platform.
Data correspond to usage on the plateform after 2015. The current usage metrics is available 48-96 hours after online publication and is updated daily on week days.
Initial download of the metrics may take a while.