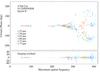
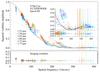
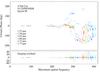
Fig. A.2
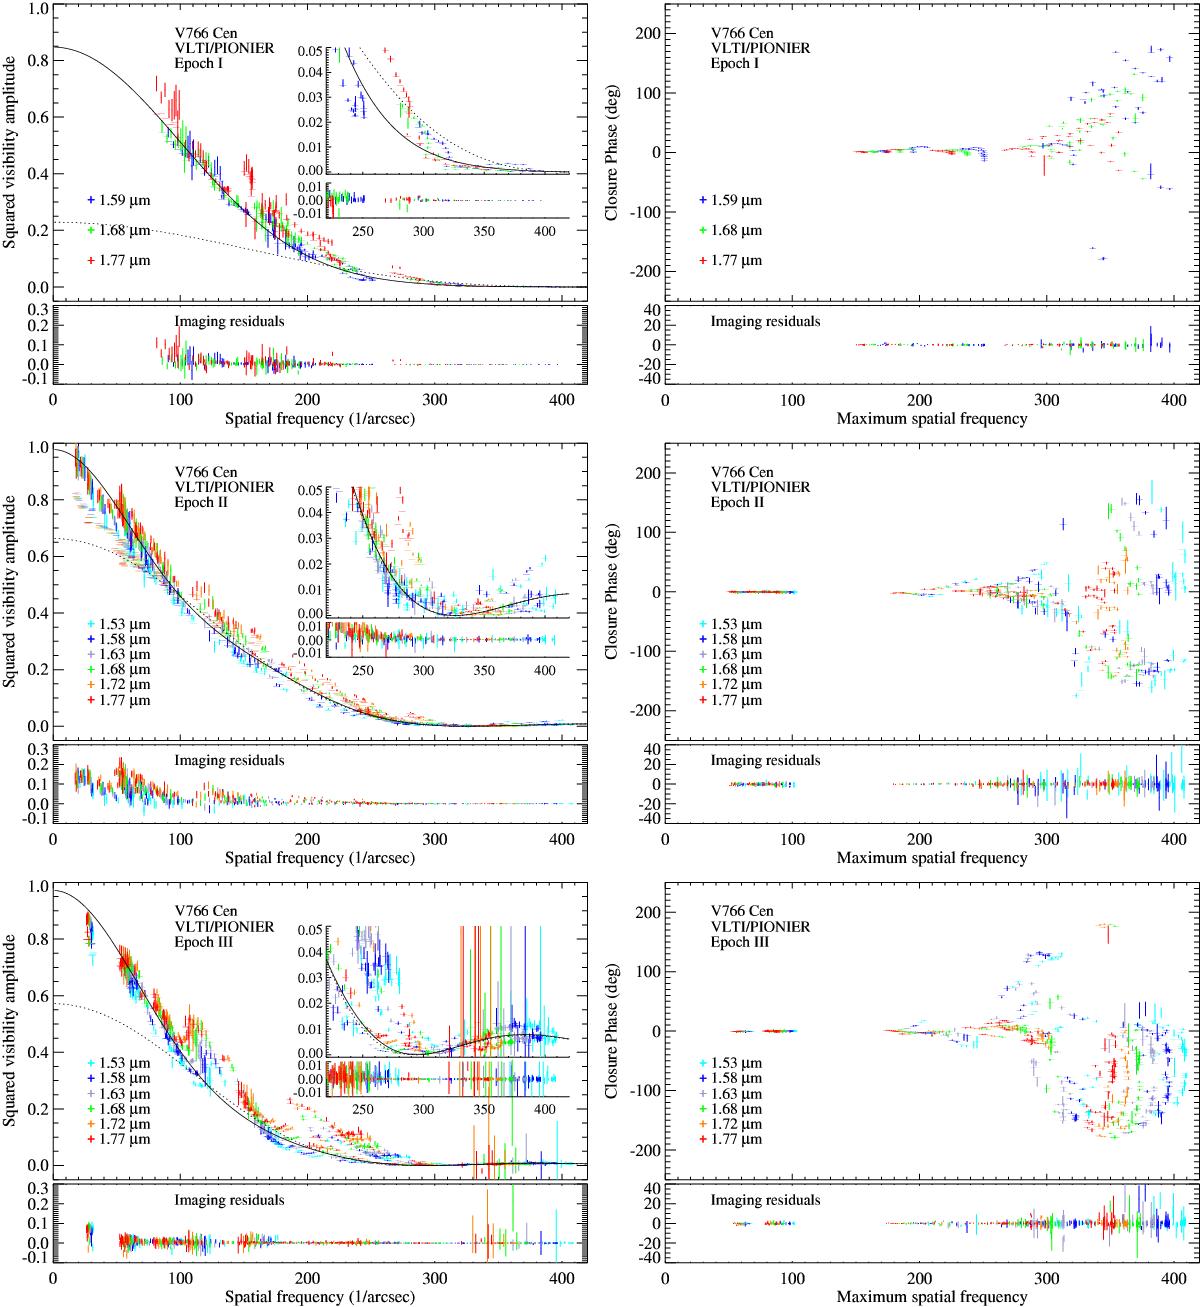
Visibility results. The left panels show the squared visibility amplitudes; the inlays enlarge the low values. The right panels show the closure phases. The vertical bars indicate the symmetric error bars; different colors denote different spectral channels. The black solid lines denote our visibility model including the stellar photosphere represented by a PHOENIX model plus a larger uniform disk describing the extended molecular atmosphere. The black dashed lines indicate the contribution of the PHOENIX model alone. The synthetic values based on the reconstructed images are shown by horizontal bars. The lower small panels show the residuals between observations and reconstructed images.
Current usage metrics show cumulative count of Article Views (full-text article views including HTML views, PDF and ePub downloads, according to the available data) and Abstracts Views on Vision4Press platform.
Data correspond to usage on the plateform after 2015. The current usage metrics is available 48-96 hours after online publication and is updated daily on week days.
Initial download of the metrics may take a while.