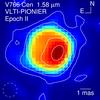
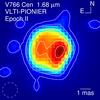
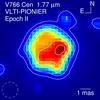
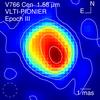
Fig. 1
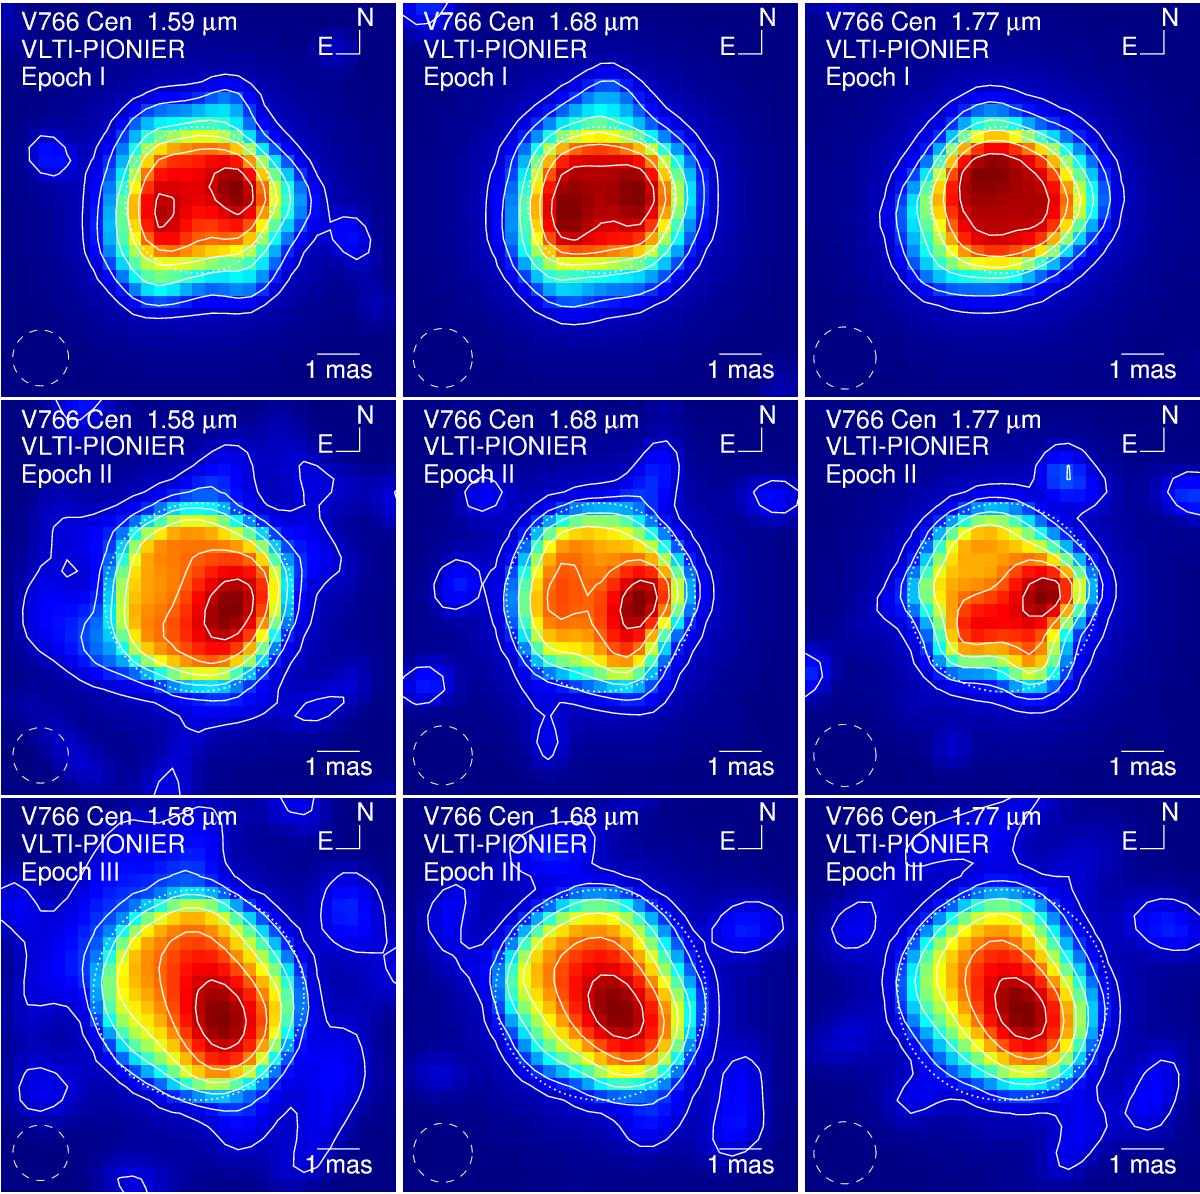
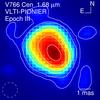
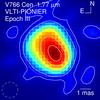
Aperture synthesis images of V766 Cen at 1.58/ 1.59 μm (left), 1.68 μm (middle), and 1.77 μm (right). The three rows represent the three epochs. Contours are drawn at levels of 90%, 70%, 50%, 30%, 10%, 3% of the peak intensity. The peak intensity is normalized to unity for each image separately. The dotted circles indicate our estimated Rosseland angular diameter. The dashed circles in the lower left corners indicate the sizes of the array angular resolution λ/ 2Bmax.
Current usage metrics show cumulative count of Article Views (full-text article views including HTML views, PDF and ePub downloads, according to the available data) and Abstracts Views on Vision4Press platform.
Data correspond to usage on the plateform after 2015. The current usage metrics is available 48-96 hours after online publication and is updated daily on week days.
Initial download of the metrics may take a while.