Fig. 6
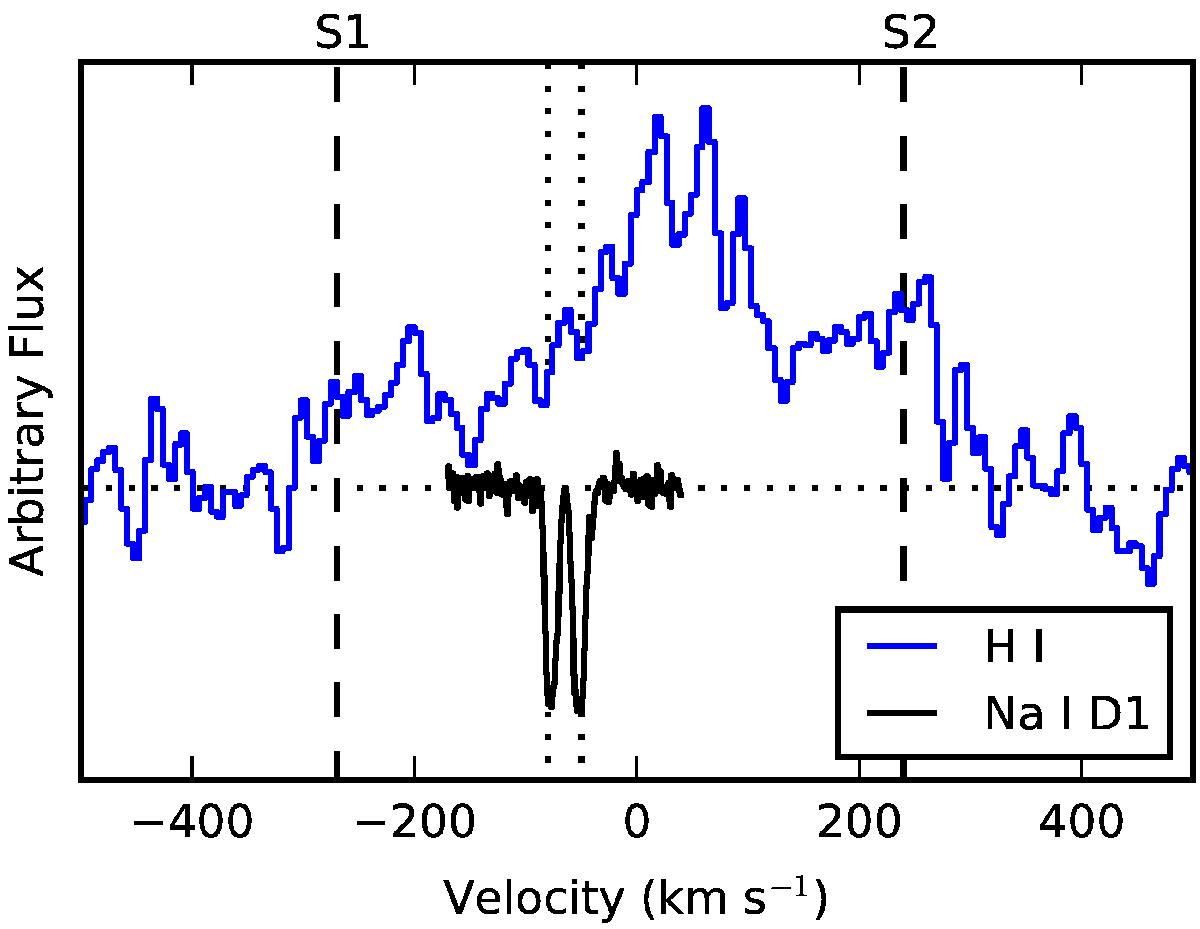
Comparison of the radial velocity of the Na I gas along the line-of-sight of iPTF16abc and H I in and around NGC 5221. The ALFA H I spectrum encompasses the position of iPTF16abc and NGC 5221. The Na I D1 profile is shown from the Apr. 24 UVES spectrum. Vertical dashed lines indicate the line-of-sight velocity of the two SDSS spectra with respect to the rest-frame of NGC 5221. The labels S1 and S2 corresponding to those in Fig. 1.
Current usage metrics show cumulative count of Article Views (full-text article views including HTML views, PDF and ePub downloads, according to the available data) and Abstracts Views on Vision4Press platform.
Data correspond to usage on the plateform after 2015. The current usage metrics is available 48-96 hours after online publication and is updated daily on week days.
Initial download of the metrics may take a while.