Fig. 5
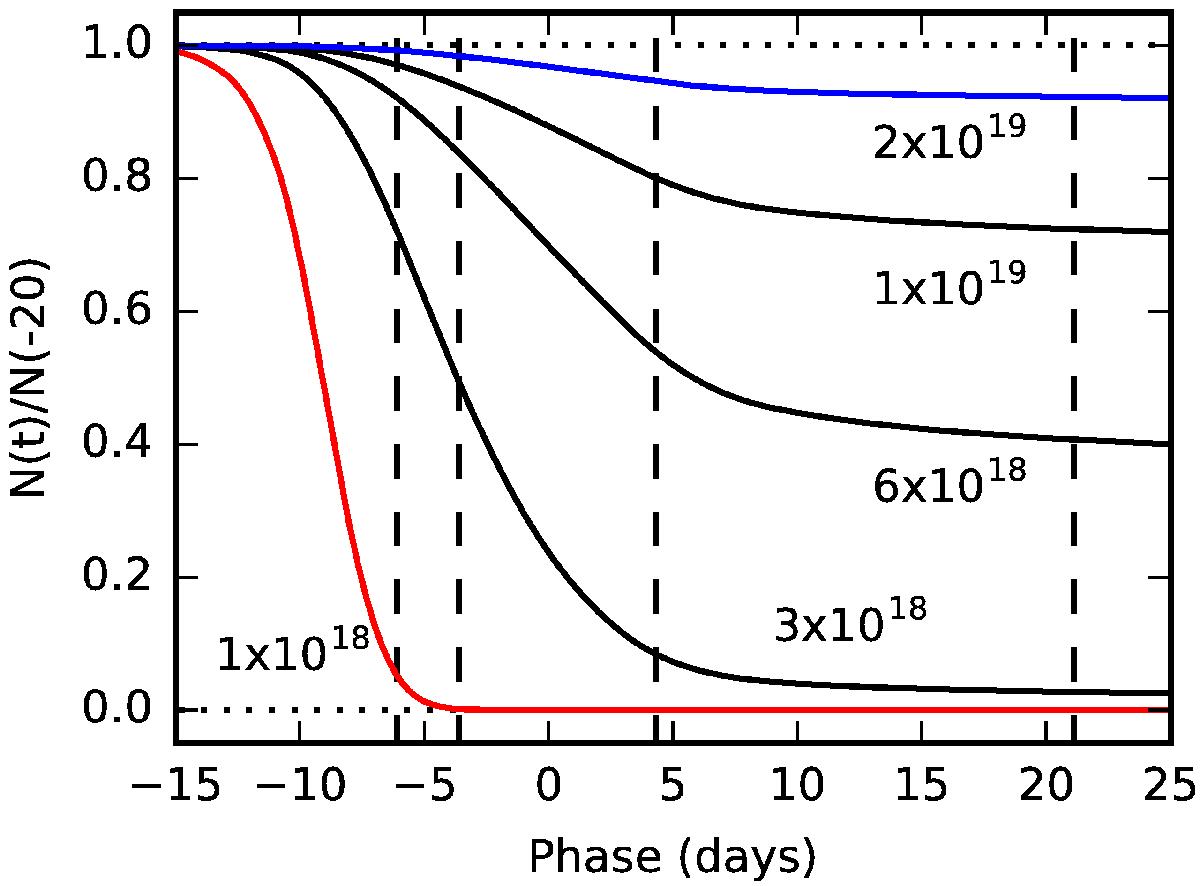
Fractional photoionisation curves of Na I gas at annotated radii in cm. The vertical dashed lines indicate the phases of the obtained spectra. The red curve at 1 × 1018 cm, defines the inner exclusion radius at which a gas cloud would have been ionised before the first spectrum was obtained. The blue curve defines the outer exclusion radius at 2 × 1019 cm, where photoionisation leads to negligible change.
Current usage metrics show cumulative count of Article Views (full-text article views including HTML views, PDF and ePub downloads, according to the available data) and Abstracts Views on Vision4Press platform.
Data correspond to usage on the plateform after 2015. The current usage metrics is available 48-96 hours after online publication and is updated daily on week days.
Initial download of the metrics may take a while.