Fig. 6
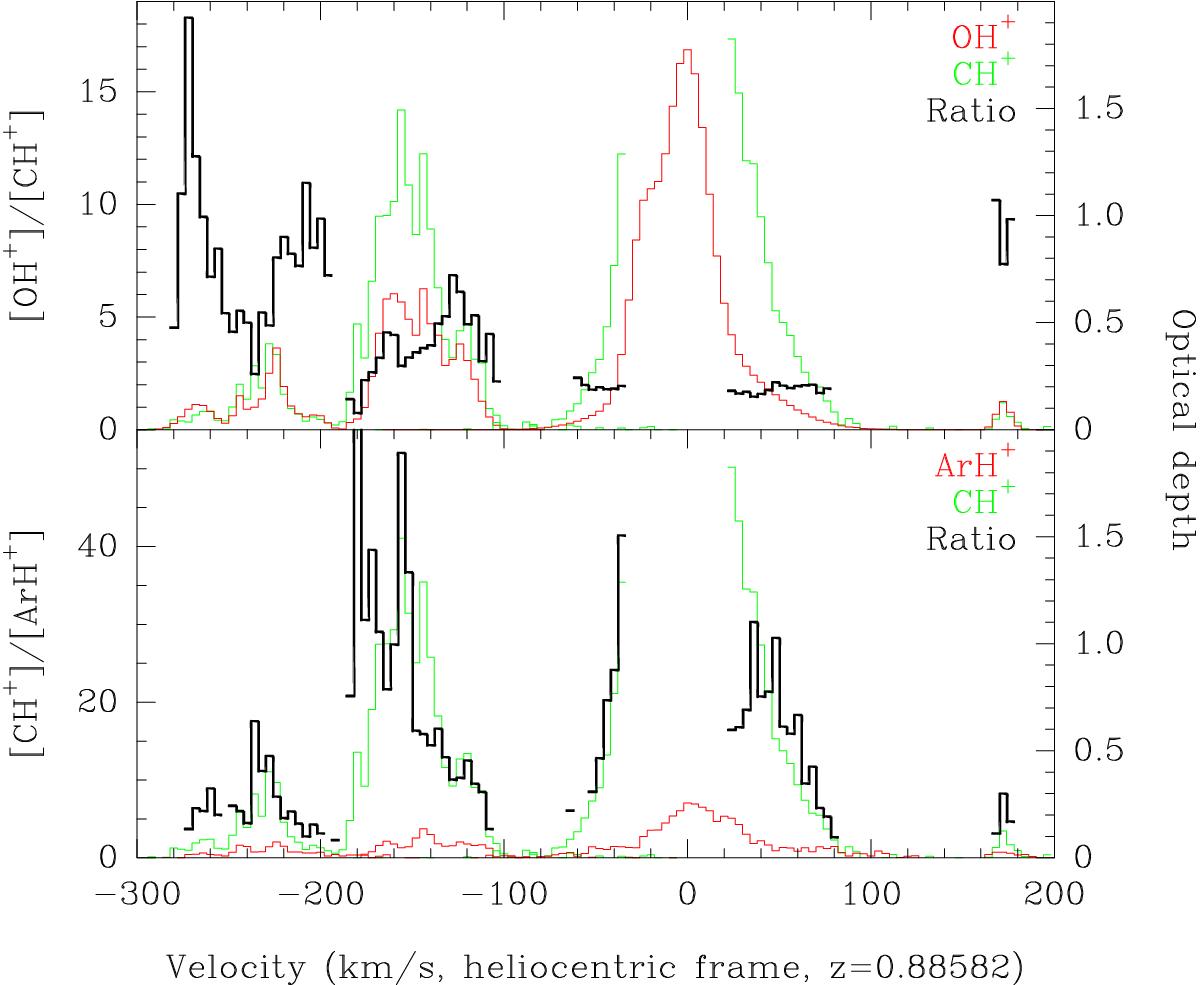
Column density ratios of [OH+]/[CH+] (top) and [CH+]/[ArH+] (bottom) toward the NE (v< −100 km s-1) and SW (v> −100 km s-1) lines of sight. The ratios are shown in black curves. The green and red curves are optical depths and translate into column densities with factors 2.85 × 10¹², 20.0 × 10¹², and 1.70 × 1012 cm-2 km-1 s for CH+, OH+, and ArH+, respectively. Channels with S/N< 3 or opacity larger than 2 were flagged prior to calculate the ratios.
Current usage metrics show cumulative count of Article Views (full-text article views including HTML views, PDF and ePub downloads, according to the available data) and Abstracts Views on Vision4Press platform.
Data correspond to usage on the plateform after 2015. The current usage metrics is available 48-96 hours after online publication and is updated daily on week days.
Initial download of the metrics may take a while.