Free Access
Fig. 5
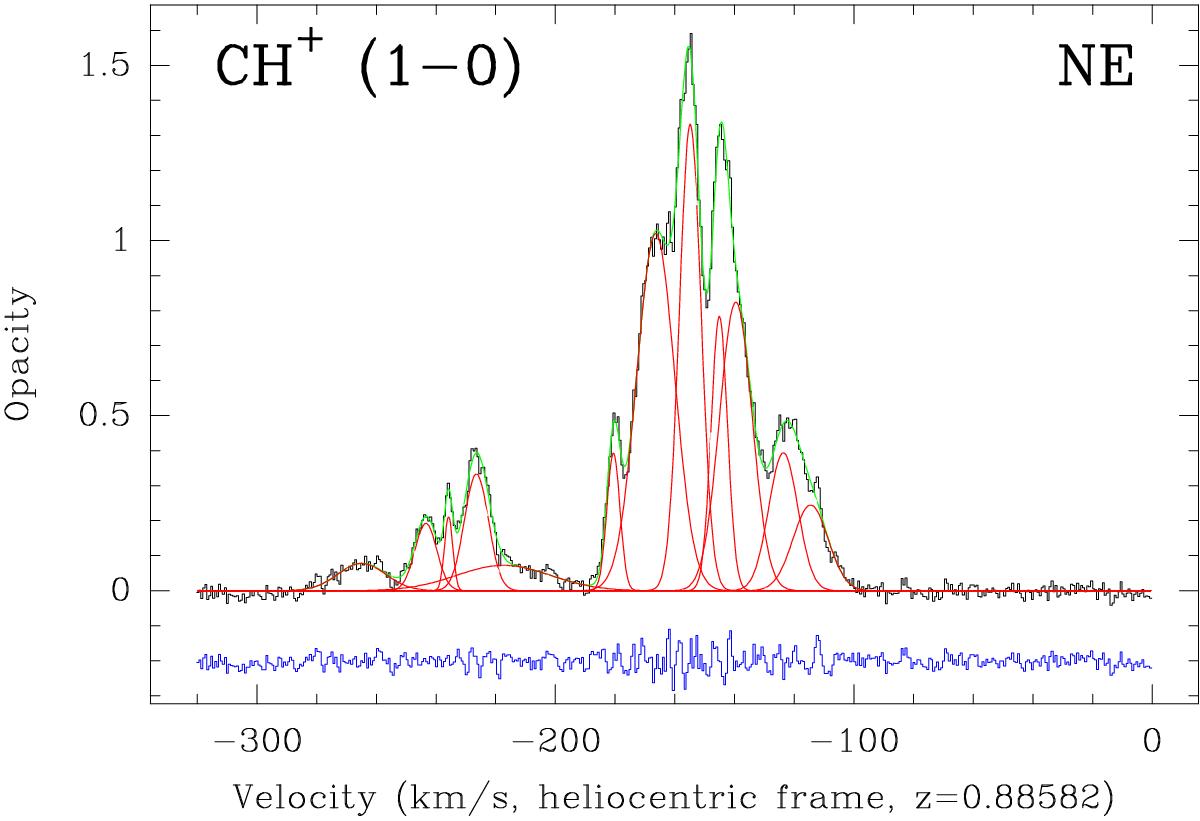
Fit of the CH+J = 1–0 line opacity profile toward the NE image of PKS 1830−211. The individual Gaussian components (listed in Table 3) are marked in red and the global resulting profile is shown in green. The fit residuals are shown in blue, offset by −0.2 in opacity.
Current usage metrics show cumulative count of Article Views (full-text article views including HTML views, PDF and ePub downloads, according to the available data) and Abstracts Views on Vision4Press platform.
Data correspond to usage on the plateform after 2015. The current usage metrics is available 48-96 hours after online publication and is updated daily on week days.
Initial download of the metrics may take a while.