Fig. A.3
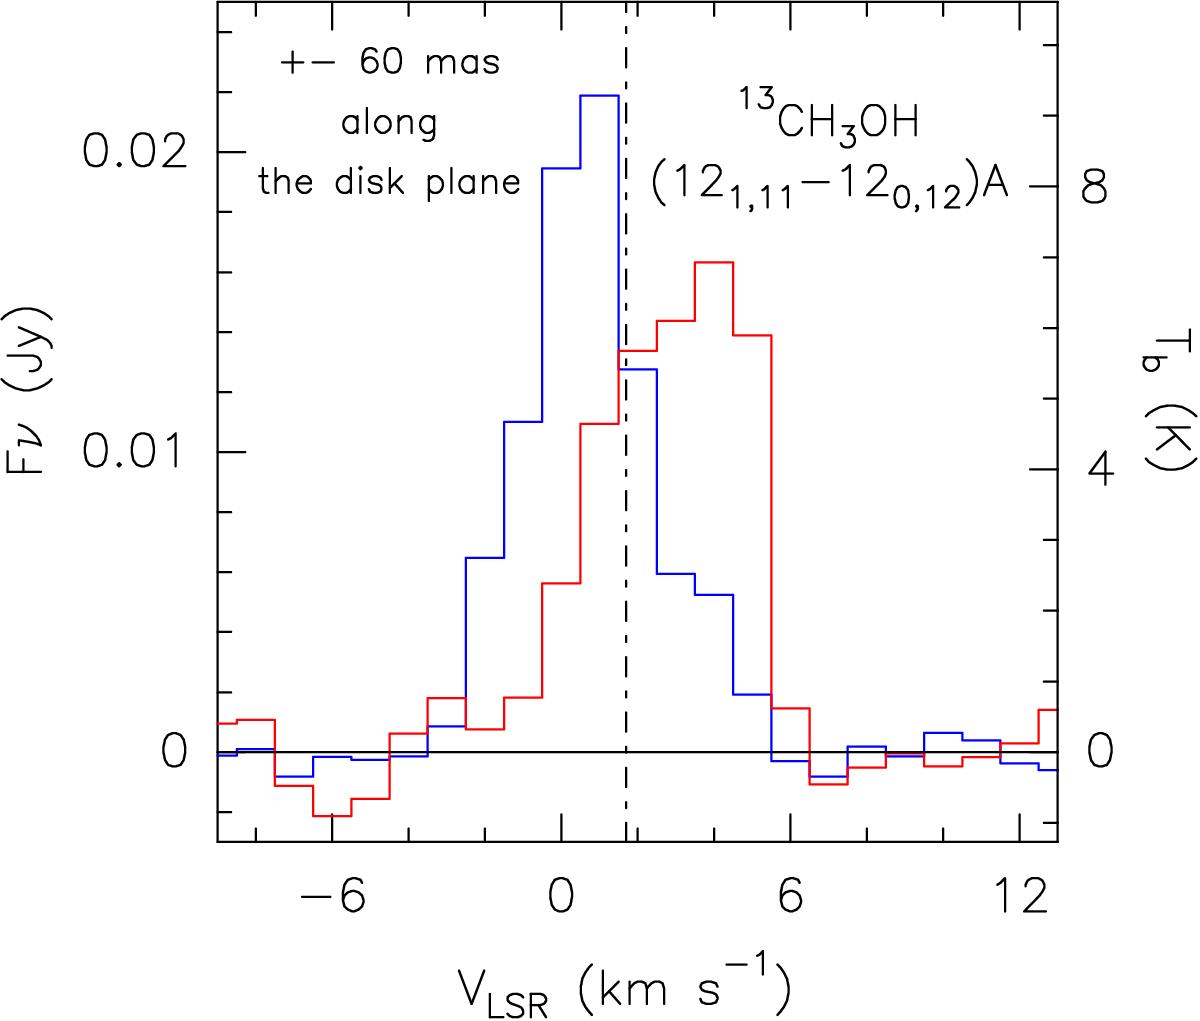
Comparison in flux density and in TB scales (TB/Fν = 482.609 K Jy-1) between the 13CH3OH(121,11–120,12)A spectrum extracted at ±0![]() 06 from the protostar (see Fig. 2: blue- and redshifted emission towards north-west and south-east, respectively) in the direction along the equatorial plane (i.e. disc plane; Lee et al. 2017). The vertical dashed line stands for the systemic VLSR velocity (+1.7 km s-1, Lee et al. 2014).
06 from the protostar (see Fig. 2: blue- and redshifted emission towards north-west and south-east, respectively) in the direction along the equatorial plane (i.e. disc plane; Lee et al. 2017). The vertical dashed line stands for the systemic VLSR velocity (+1.7 km s-1, Lee et al. 2014).
Current usage metrics show cumulative count of Article Views (full-text article views including HTML views, PDF and ePub downloads, according to the available data) and Abstracts Views on Vision4Press platform.
Data correspond to usage on the plateform after 2015. The current usage metrics is available 48-96 hours after online publication and is updated daily on week days.
Initial download of the metrics may take a while.