Fig. 3
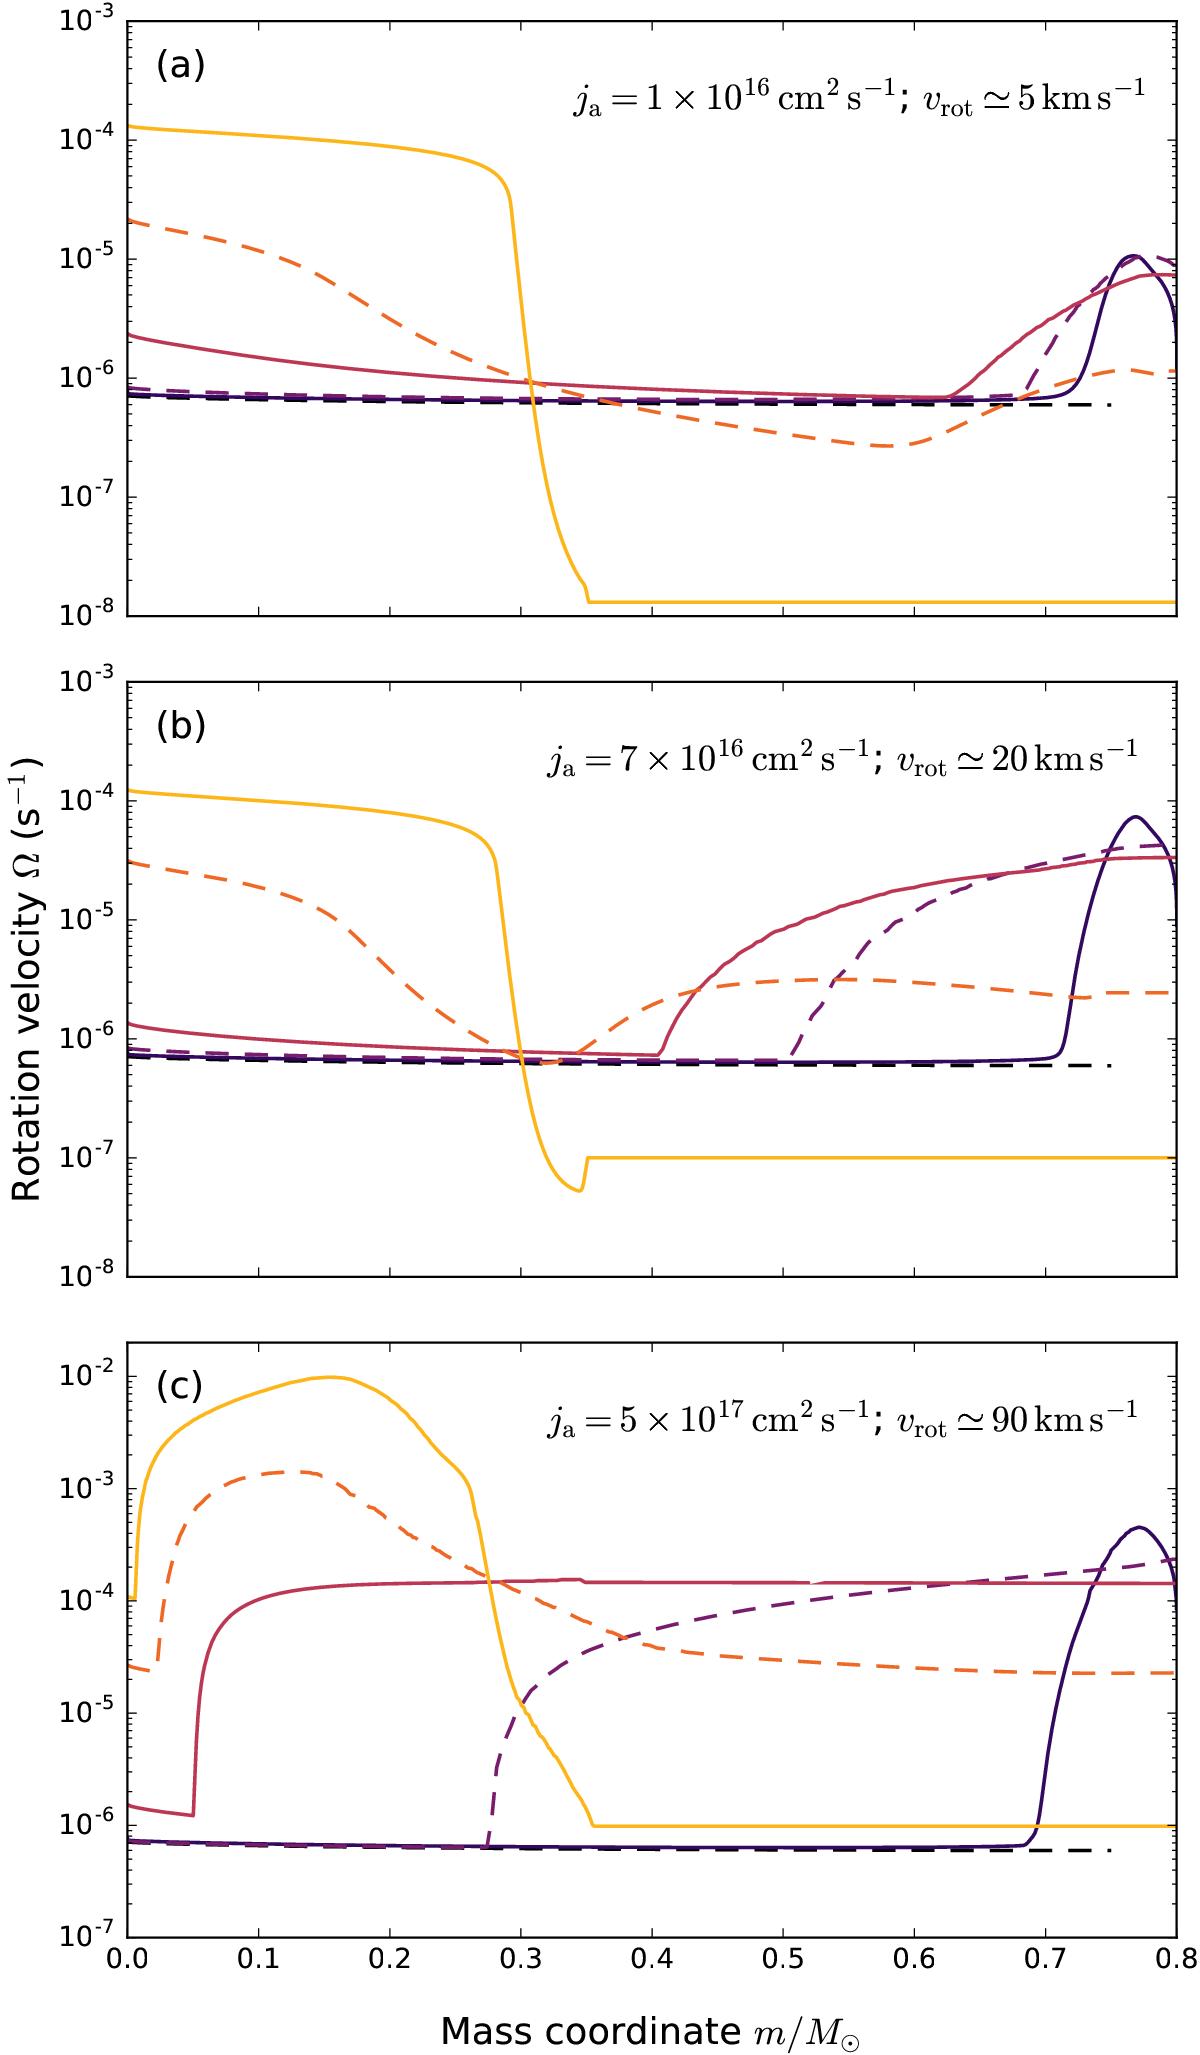
Evolution of angular rotation velocity profiles for three different values of ja. The dashed black profile corresponds to just before mass transfer (“1”) and subsequent profiles, plotted in alternating line types of progressively lighter colours, correspond to end of mass transfer (“2”), return to thermal equilibrium (“3”), main sequence (between “3” and “4”), before first dredge-up (“5”) and after first dredge-up (“6”). The last two profiles demonstrate the spin-up of the core after the main sequence. Note the different y scales.
Current usage metrics show cumulative count of Article Views (full-text article views including HTML views, PDF and ePub downloads, according to the available data) and Abstracts Views on Vision4Press platform.
Data correspond to usage on the plateform after 2015. The current usage metrics is available 48-96 hours after online publication and is updated daily on week days.
Initial download of the metrics may take a while.