Fig. 5
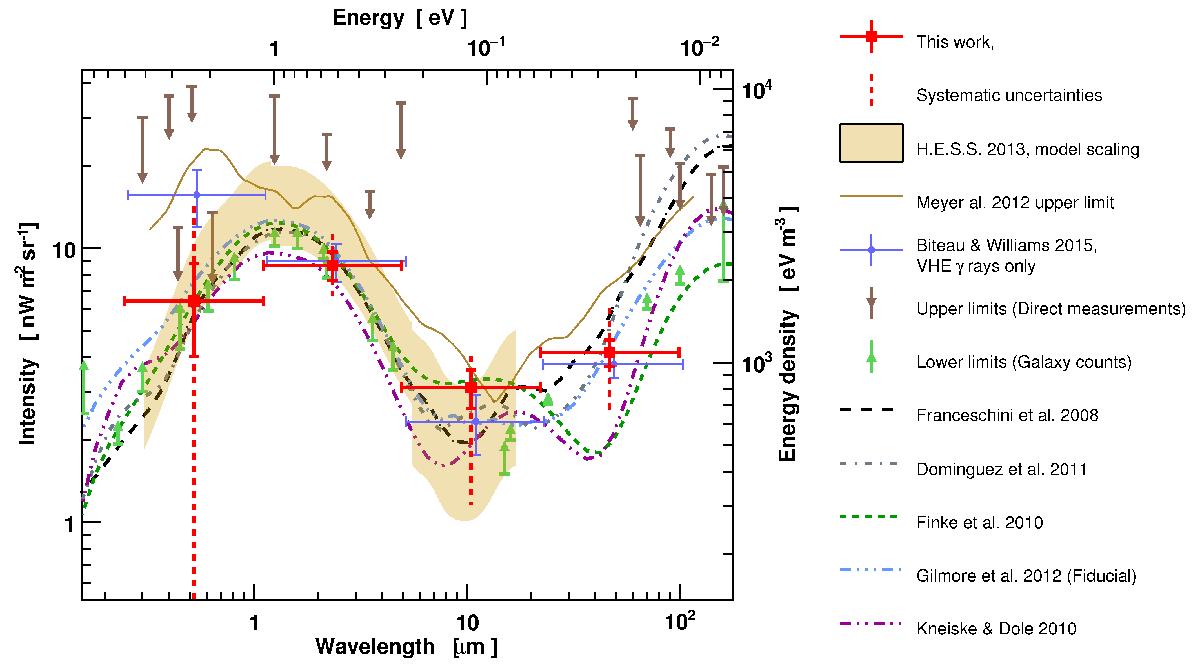
Combined EBL levels (red points) compared with various constraints and models. The dashed black line represents the local SED of the model given in Franceschini et al. (2008), which is used as the template for the HESS2013 model scaling (yellow area). Additional models represented are Dominguez et al. (2011; grey dot-dashed line), Finke et al. (2010; green dashed line), Gilmore et al. (2012; blue dot-dashed line), and the lower-limit model of Kneiske & Dole (2010; purple dot-dashed line). The model-independent upper limit using VHE and HE data Meyer et al. (2012) is shown as a thin brown line. The model-independent measurement of Biteau & Williams (2015) restricted to the use of VHE data is represented by blue points.
Current usage metrics show cumulative count of Article Views (full-text article views including HTML views, PDF and ePub downloads, according to the available data) and Abstracts Views on Vision4Press platform.
Data correspond to usage on the plateform after 2015. The current usage metrics is available 48-96 hours after online publication and is updated daily on week days.
Initial download of the metrics may take a while.