Fig. 4
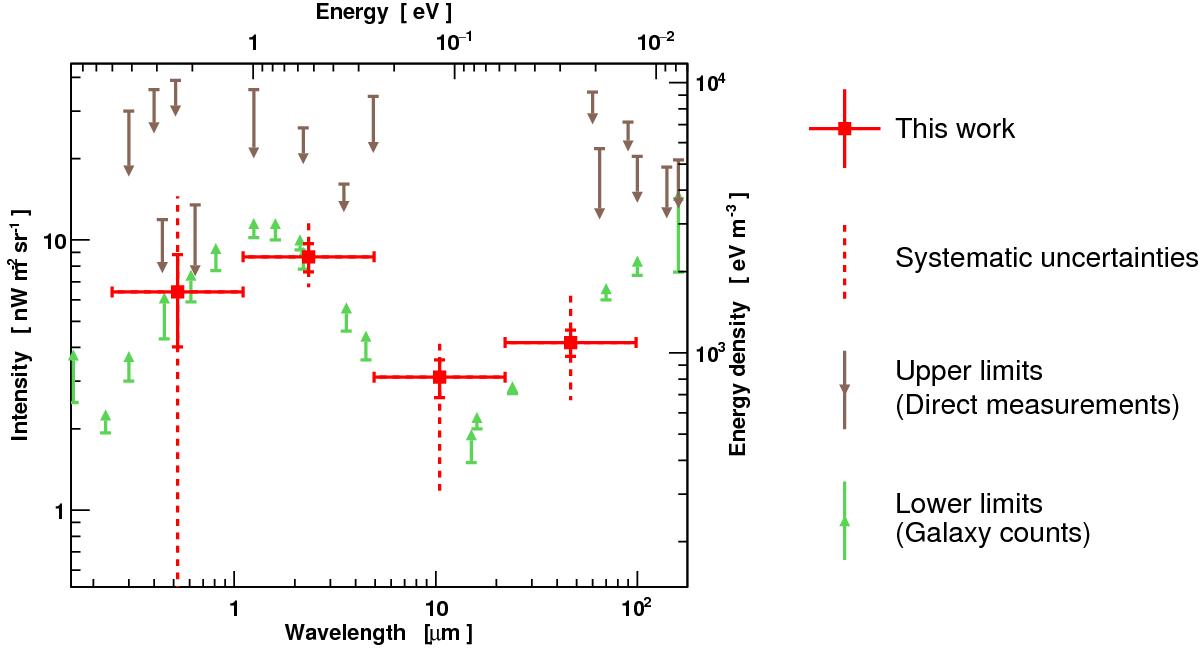
Measured EBL spectrum. Obtained levels are represented by the red points. Horizontal lines represent the bandwidth over which the integrated EBL levels apply. The vertical solid lines represent the 1-σ (statistical) errors from Eq. (12). The dashed lines represent the systematic uncertainties on fitted EBL levels conservatively estimated as explained in the text. Direct constraints on the EBL collected from Dwek & Krennrich (2013) and Biteau & Williams (2015) are shown; lower and upper limits are represented by green and brown arrows, respectively.
Current usage metrics show cumulative count of Article Views (full-text article views including HTML views, PDF and ePub downloads, according to the available data) and Abstracts Views on Vision4Press platform.
Data correspond to usage on the plateform after 2015. The current usage metrics is available 48-96 hours after online publication and is updated daily on week days.
Initial download of the metrics may take a while.