Fig. 6
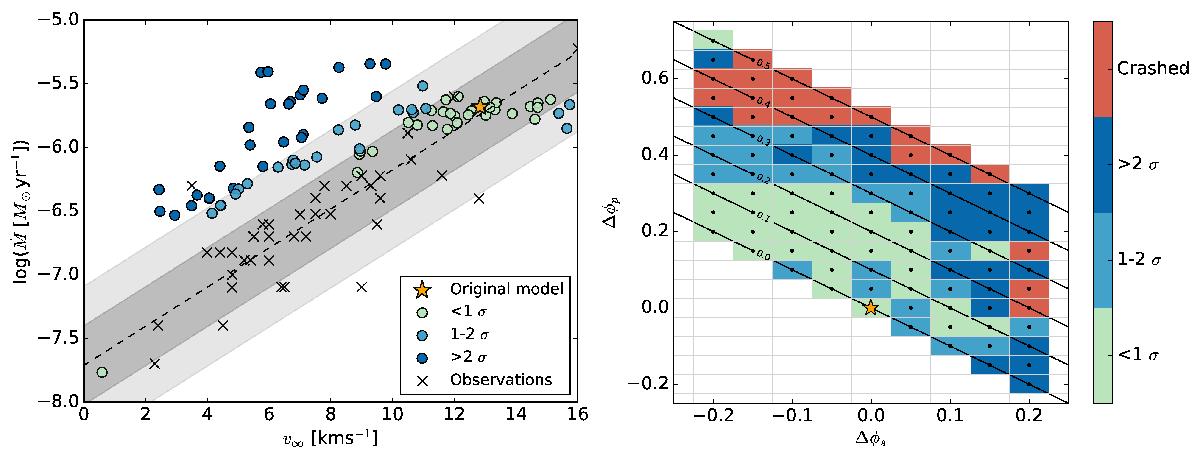
Left: mass-loss rates and wind velocities of models with phase shift at the inner boundary (circles), the original model (orange star) and observations (crosses). The dark grey area is the standard deviation σ of the mass-loss rates of the observations, and the light grey is 2σ. Right: each square represent a model; Δφs, Δφp and Δφtot indicated. The colours are the same as in the left panel; models <1σ in the mass-loss rate and velocity plot are in light green.
Current usage metrics show cumulative count of Article Views (full-text article views including HTML views, PDF and ePub downloads, according to the available data) and Abstracts Views on Vision4Press platform.
Data correspond to usage on the plateform after 2015. The current usage metrics is available 48-96 hours after online publication and is updated daily on week days.
Initial download of the metrics may take a while.