Free Access
Fig. 2
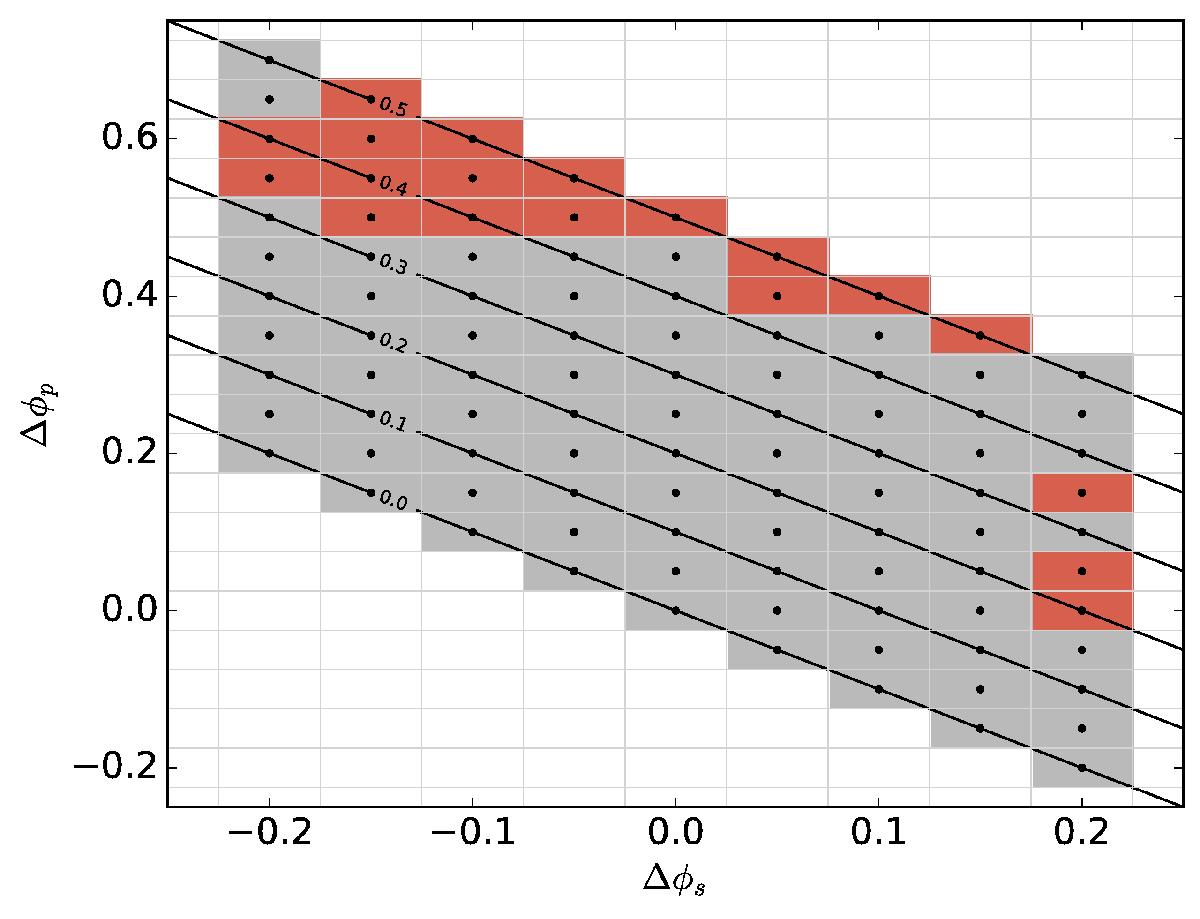
Overview of the calculated models, showing the Δφs and Δφp used. The points represent each of the models; grey background means the model finished while the red background means the model did not converge (Sect. 2.1.2). The lines show Δφtot = Δφs + Δφp.
Current usage metrics show cumulative count of Article Views (full-text article views including HTML views, PDF and ePub downloads, according to the available data) and Abstracts Views on Vision4Press platform.
Data correspond to usage on the plateform after 2015. The current usage metrics is available 48-96 hours after online publication and is updated daily on week days.
Initial download of the metrics may take a while.