Fig. 12
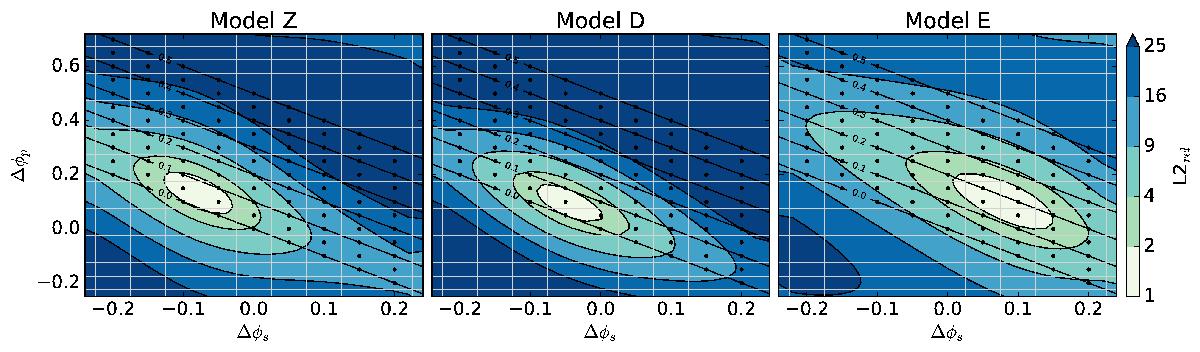
Comparison between the 1D pulsation models, from Bessell et al. (1996), and the boundary conditions described in Sect. 2.1.1 and Appendix A, defined by Δφs and Δφp. The colours show the relative least-squares error (L2rel), and the points indicates our calculated models and lines show Δφtot = Δφs + Δφp. Left and middle: model Z and model D from Bessell et al. (1996), which are fundamental mode pulsator models of o Ceti. Right: model E from Bessell et al. (1996), a first-overtone pulsator model of o Ceti.
Current usage metrics show cumulative count of Article Views (full-text article views including HTML views, PDF and ePub downloads, according to the available data) and Abstracts Views on Vision4Press platform.
Data correspond to usage on the plateform after 2015. The current usage metrics is available 48-96 hours after online publication and is updated daily on week days.
Initial download of the metrics may take a while.