Fig. 11
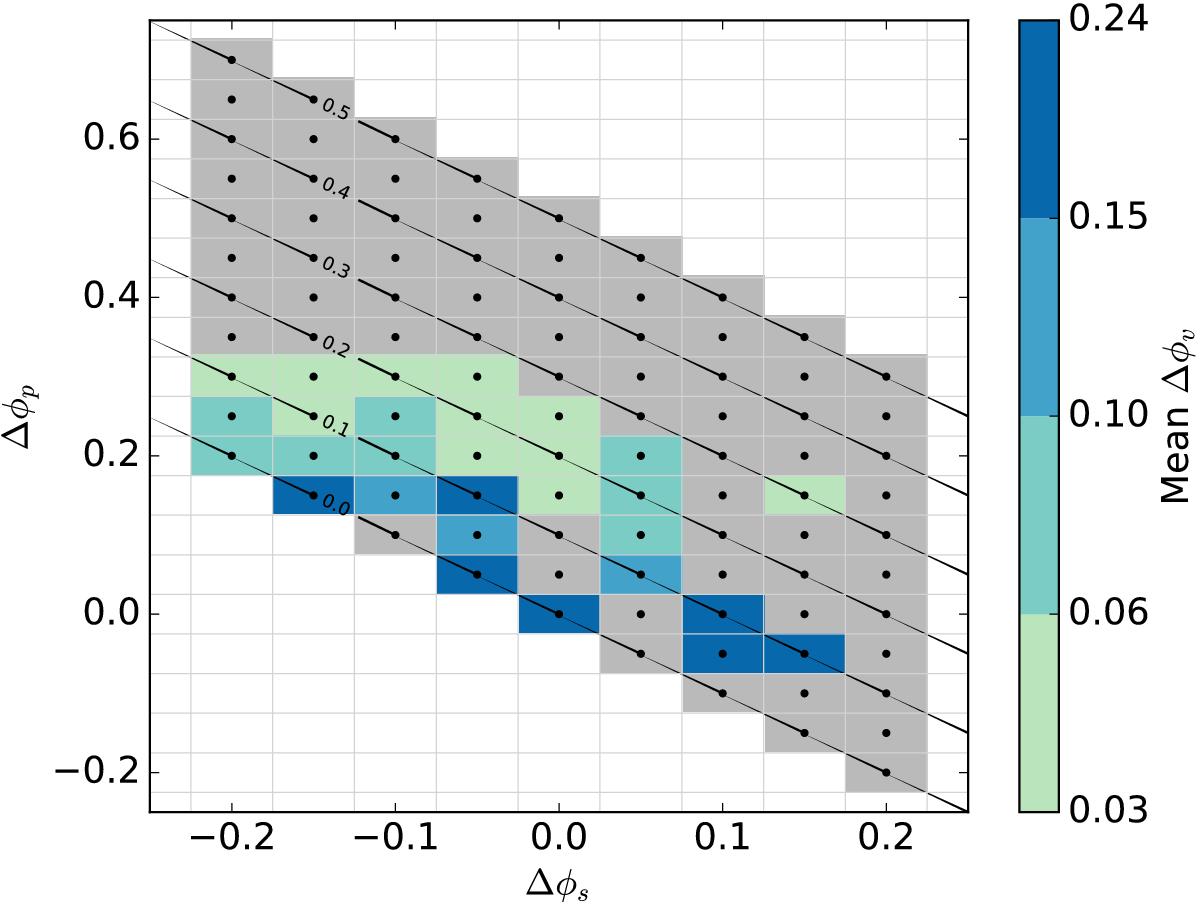
Comparison between synthetic RV curves of models and the running mean of the observations, seen in Fig. 10. The colour indicates the mean distance between the maximum and the minimum of that model’s RV curve and the running mean, described in Eq. (2). The grey squares are models that were previously discarded as they did not reproduce a realistic wind velocity and mass-loss rate combination.
Current usage metrics show cumulative count of Article Views (full-text article views including HTML views, PDF and ePub downloads, according to the available data) and Abstracts Views on Vision4Press platform.
Data correspond to usage on the plateform after 2015. The current usage metrics is available 48-96 hours after online publication and is updated daily on week days.
Initial download of the metrics may take a while.