Fig. 9
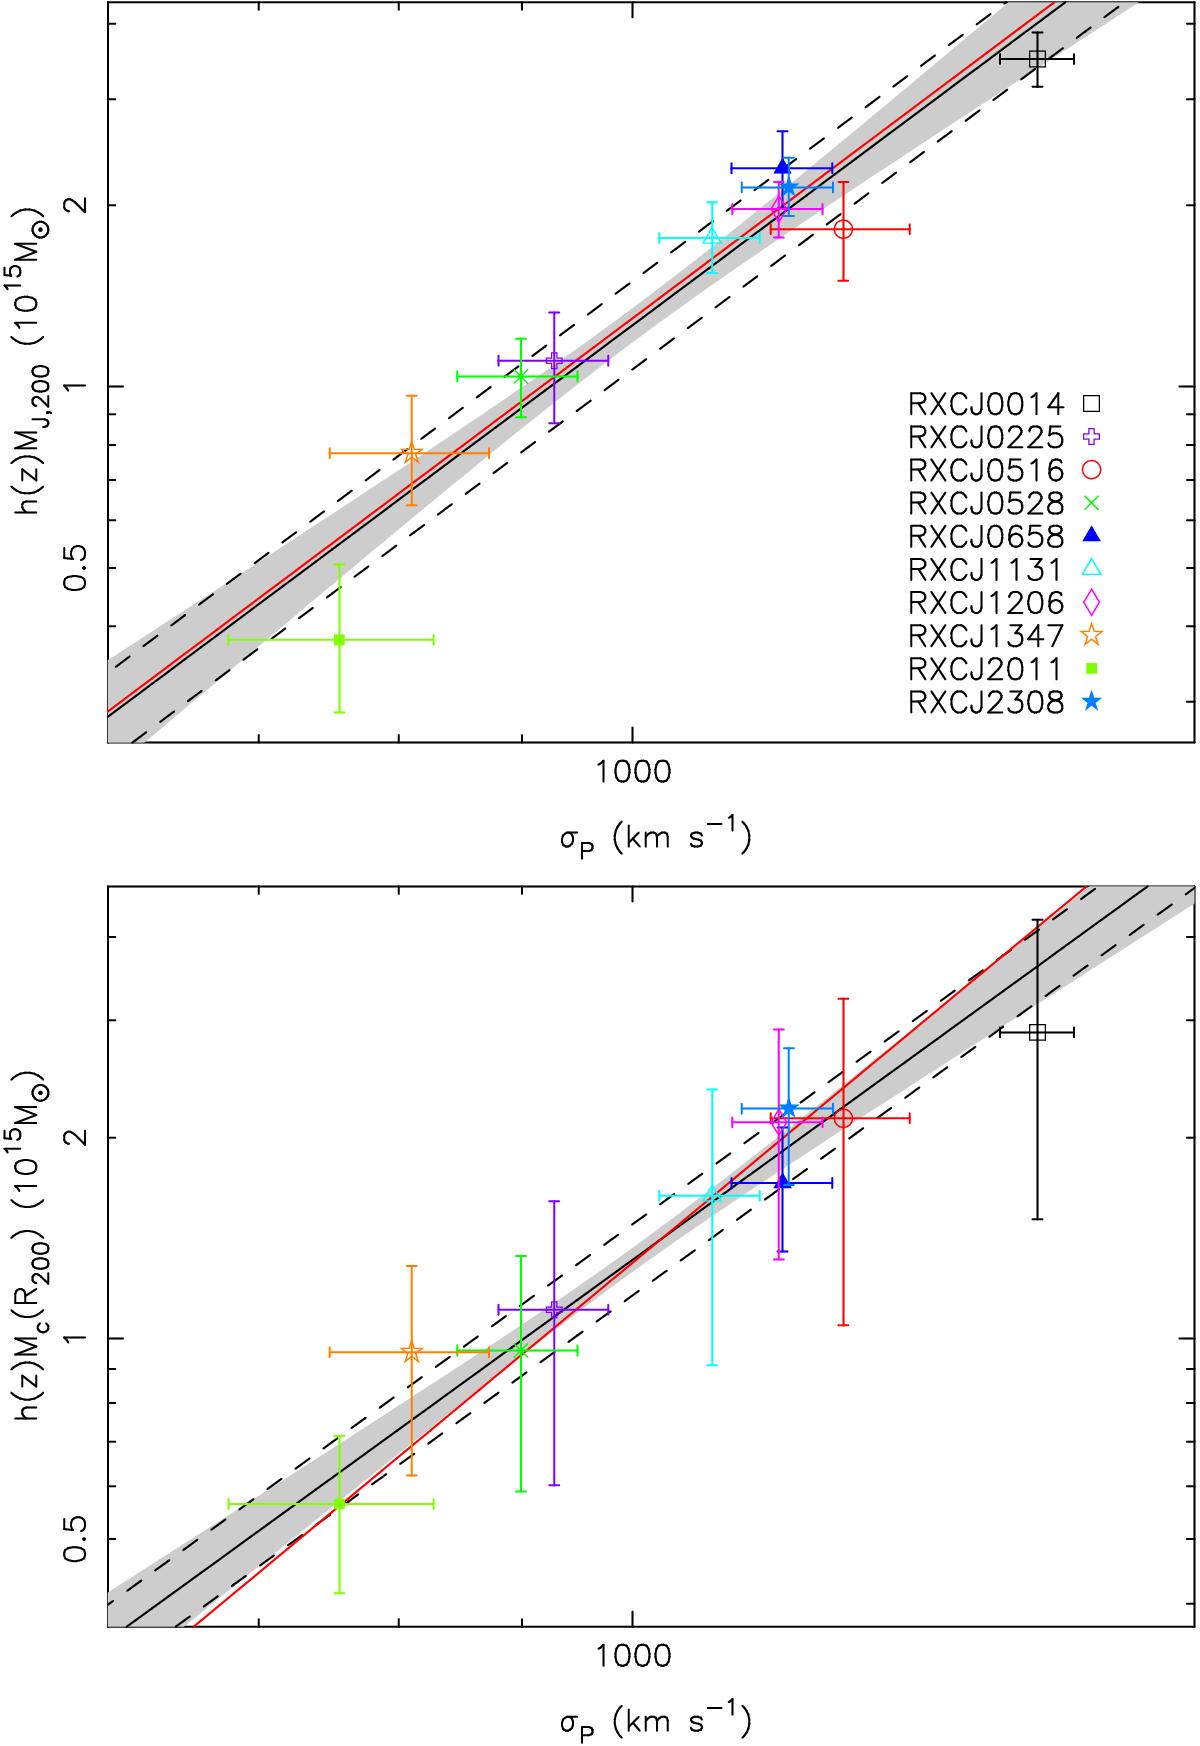
Calibration of the mass-velocity dispersion scaling relation with the Jeans (top panel) and caustic (bottom panel) masses. The black line represents the best-fit regression line and the shaded area gives its statistical uncertainty. The dashed lines delimit the scatter in mass at fixed velocity dispersion. The best-fit relation obtained by Biviano et al. (2006) is indicated by the red line.
Current usage metrics show cumulative count of Article Views (full-text article views including HTML views, PDF and ePub downloads, according to the available data) and Abstracts Views on Vision4Press platform.
Data correspond to usage on the plateform after 2015. The current usage metrics is available 48-96 hours after online publication and is updated daily on week days.
Initial download of the metrics may take a while.