Fig. 8
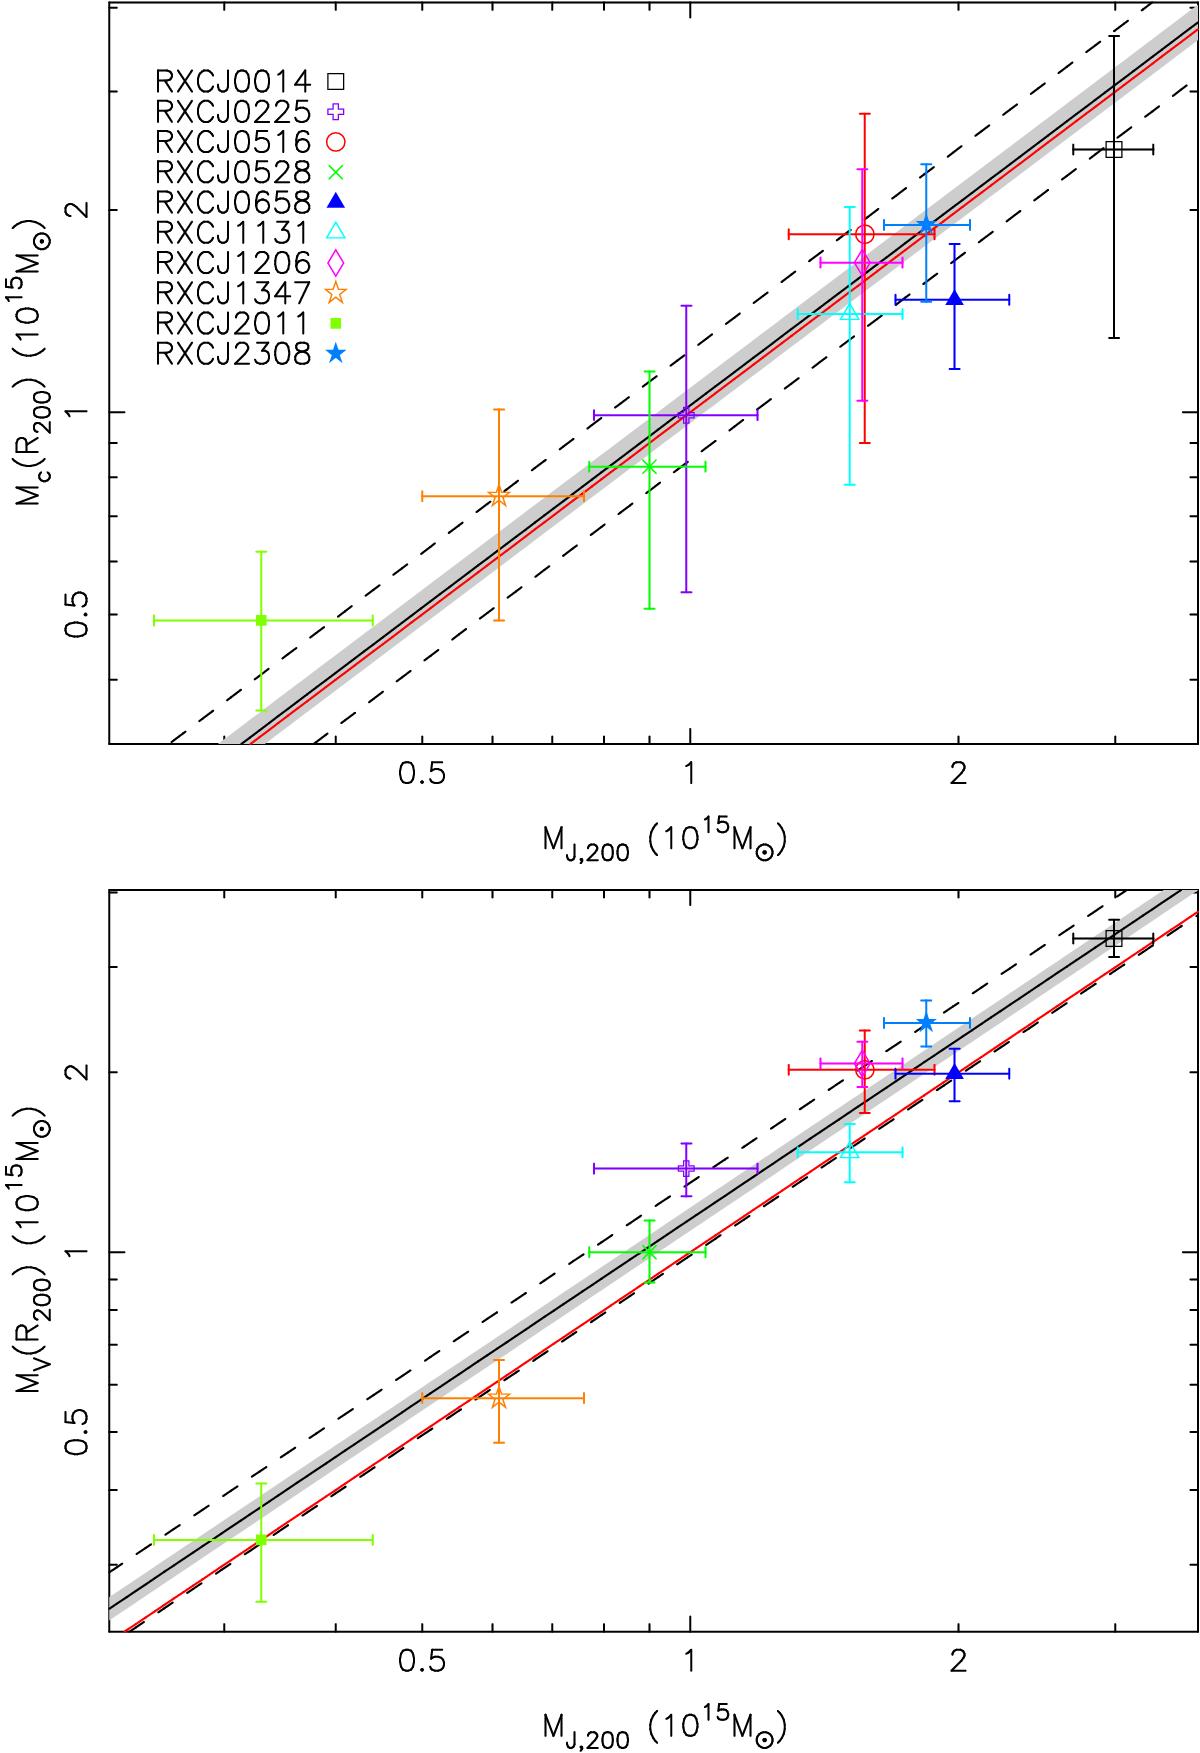
Comparison of the Jeans, caustic (top panel), and virial (bottom panel) estimators. In both panels, the red line represents equality. The black line has an intercept corresponding to the geometrical mean of the mass ratio; the shaded area traces its 1σ uncertainty estimated from bootstrapping. The dashed lines indicate the orthogonal scatter σ⊥ of the clusters around the mean ratio.
Current usage metrics show cumulative count of Article Views (full-text article views including HTML views, PDF and ePub downloads, according to the available data) and Abstracts Views on Vision4Press platform.
Data correspond to usage on the plateform after 2015. The current usage metrics is available 48-96 hours after online publication and is updated daily on week days.
Initial download of the metrics may take a while.