Fig. 4
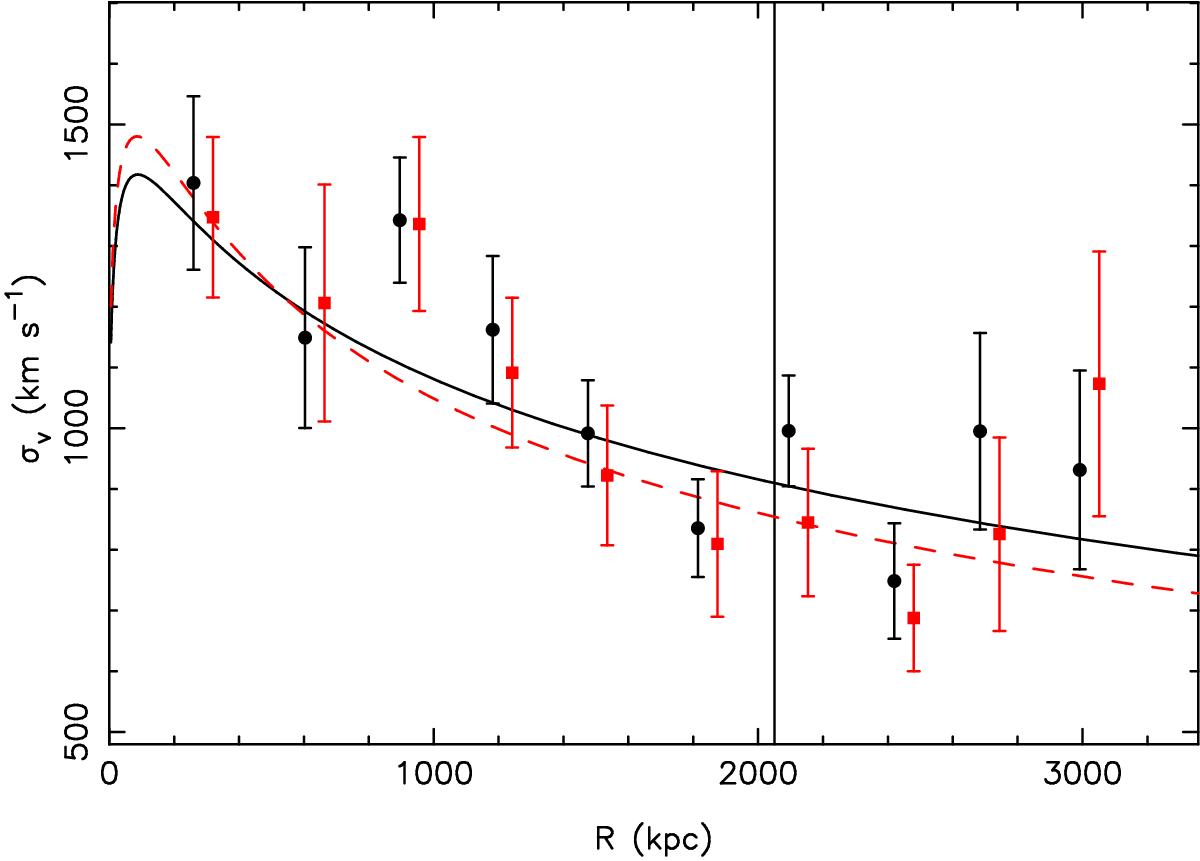
Velocity dispersion profile of RXC J1206. The black solid curve shows the Jeans prediction given the best-fit parameters for the whole population (black points). The red dashed curve is the solution obtained using the red-sequence galaxies only (red points). We note here that we did not fit these profiles. The vertical line marks R200.
Current usage metrics show cumulative count of Article Views (full-text article views including HTML views, PDF and ePub downloads, according to the available data) and Abstracts Views on Vision4Press platform.
Data correspond to usage on the plateform after 2015. The current usage metrics is available 48-96 hours after online publication and is updated daily on week days.
Initial download of the metrics may take a while.