Free Access
Fig. 3
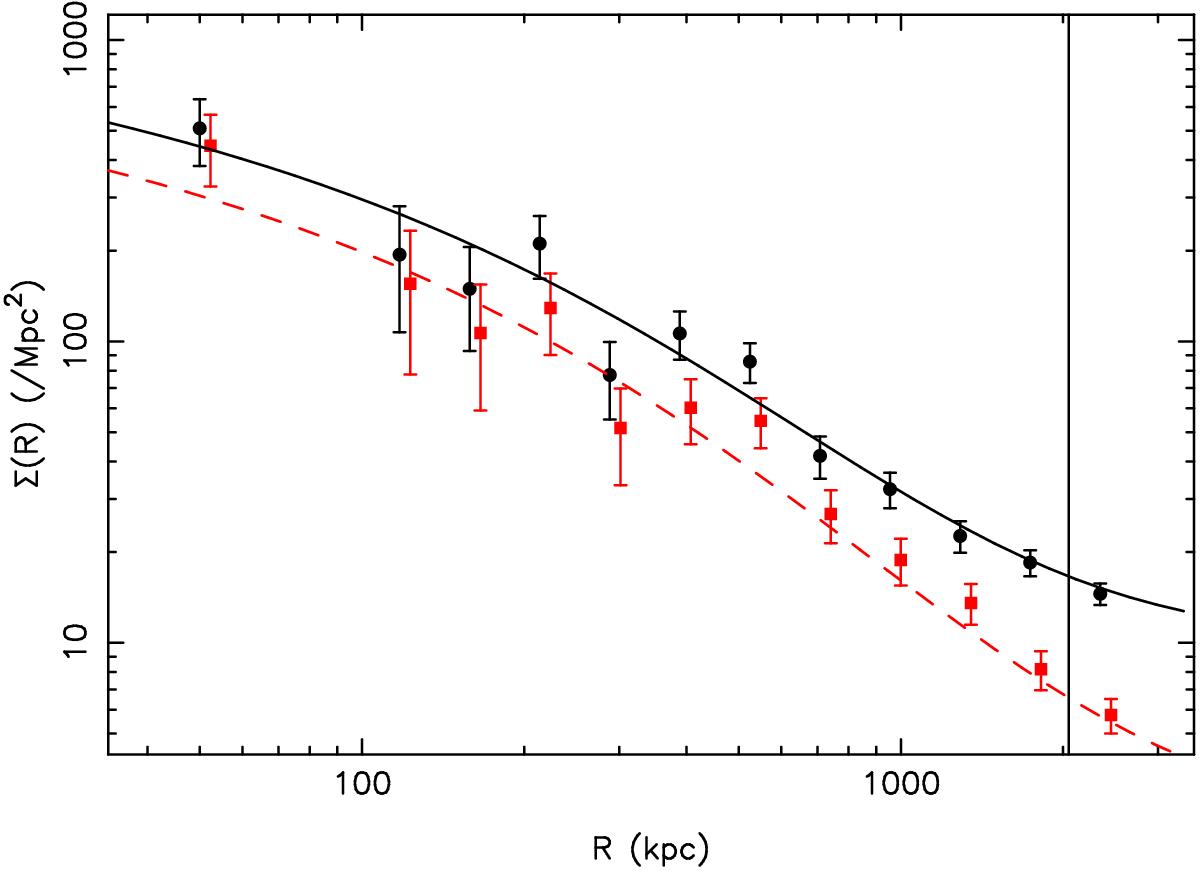
Galaxy surface density profile of RXC J1206 (black points). The black solid curve shows the best-fit NFW model plus a constant background. The red-dashed curve and red points are for the red-sequence galaxies. The vertical line shows R200.
Current usage metrics show cumulative count of Article Views (full-text article views including HTML views, PDF and ePub downloads, according to the available data) and Abstracts Views on Vision4Press platform.
Data correspond to usage on the plateform after 2015. The current usage metrics is available 48-96 hours after online publication and is updated daily on week days.
Initial download of the metrics may take a while.