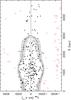
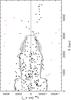
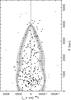
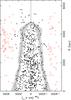
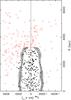
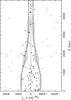
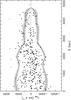
Fig. C.3
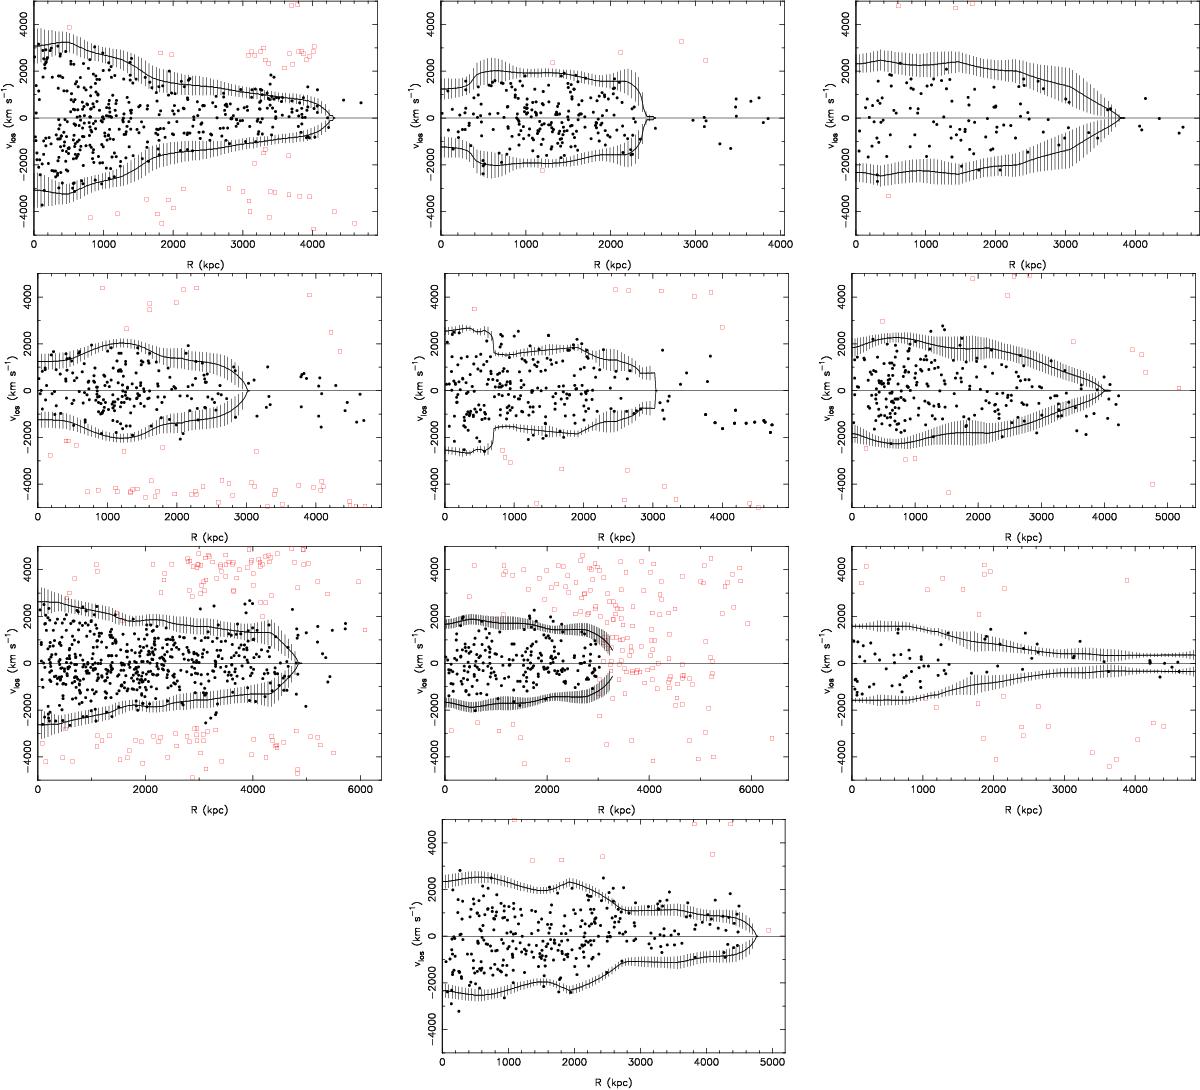
Galaxy distribution in PPS. Black points are galaxies retained as cluster members by our iterative 3σ clipping procedure, whereas red squares are galaxies that were discarded. The black curves represent the caustic amplitude (the vertical lines show their 1σ uncertainty). We arbitrarily limited the member selection to within 3 Mpc for RXC J1347; the cluster main body is hardly distinguishable from interlopers beyond this radius. From left to right, top to bottom: RXC J0014, RXC J0225, RXC J0516, RXC J0528, RXC J0658, RXC J1131, RXC J1206, RXC J1347, RXC J2011, and RXC J2308.
Current usage metrics show cumulative count of Article Views (full-text article views including HTML views, PDF and ePub downloads, according to the available data) and Abstracts Views on Vision4Press platform.
Data correspond to usage on the plateform after 2015. The current usage metrics is available 48-96 hours after online publication and is updated daily on week days.
Initial download of the metrics may take a while.