Fig. 2
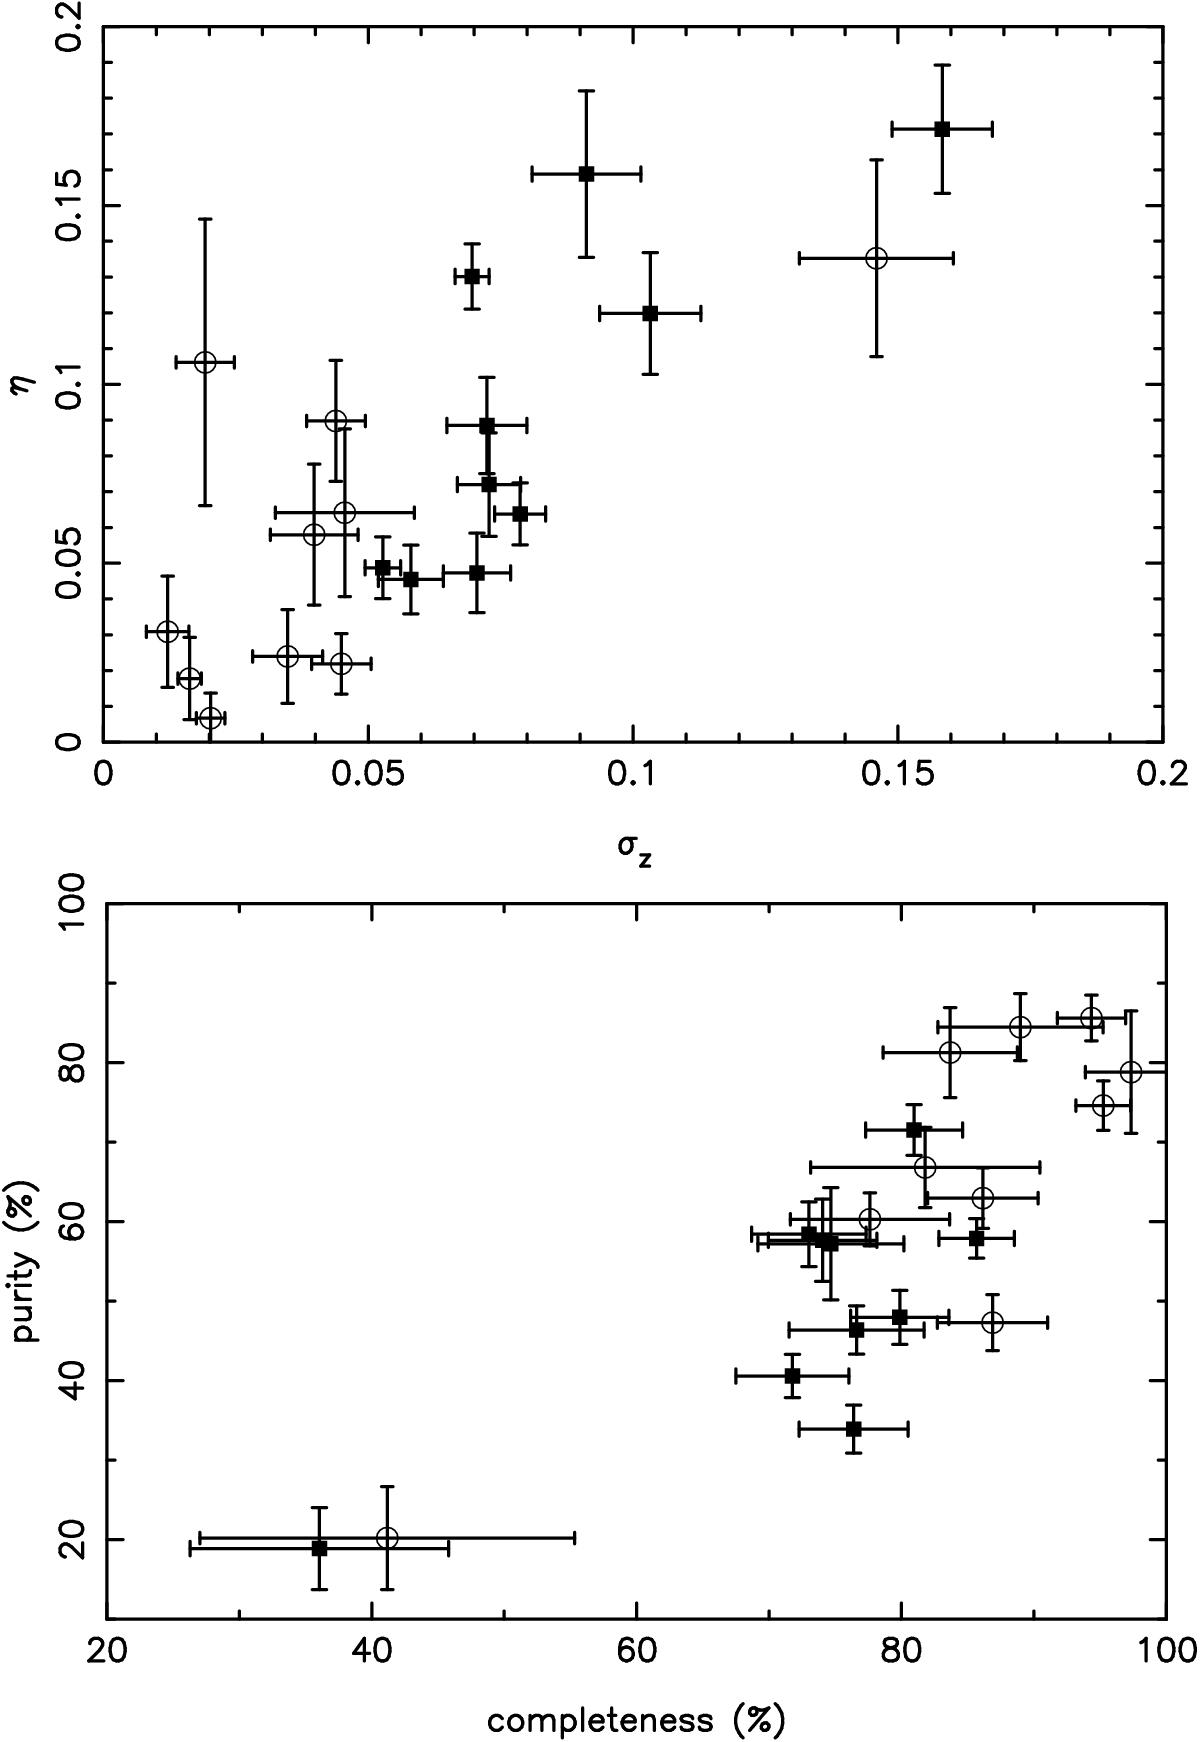
Top panel: photometric redshift accuracy σz versus fraction of catastrophic errors η. Bottom panel: completeness versus purity of the zphot catalogues. In both panels, filled squares are for the whole population, whereas empty circles are for the red-sequence galaxies only. Error bars were estimated by repeating the measurements on 100 randomly-picked training and testing samples. Notice that the worst values are for RXC J2011, which was observed only in two filters.
Current usage metrics show cumulative count of Article Views (full-text article views including HTML views, PDF and ePub downloads, according to the available data) and Abstracts Views on Vision4Press platform.
Data correspond to usage on the plateform after 2015. The current usage metrics is available 48-96 hours after online publication and is updated daily on week days.
Initial download of the metrics may take a while.