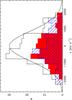
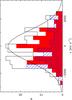
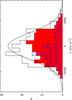
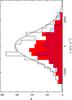
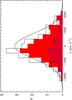
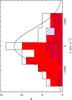
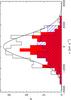
Fig. C.2
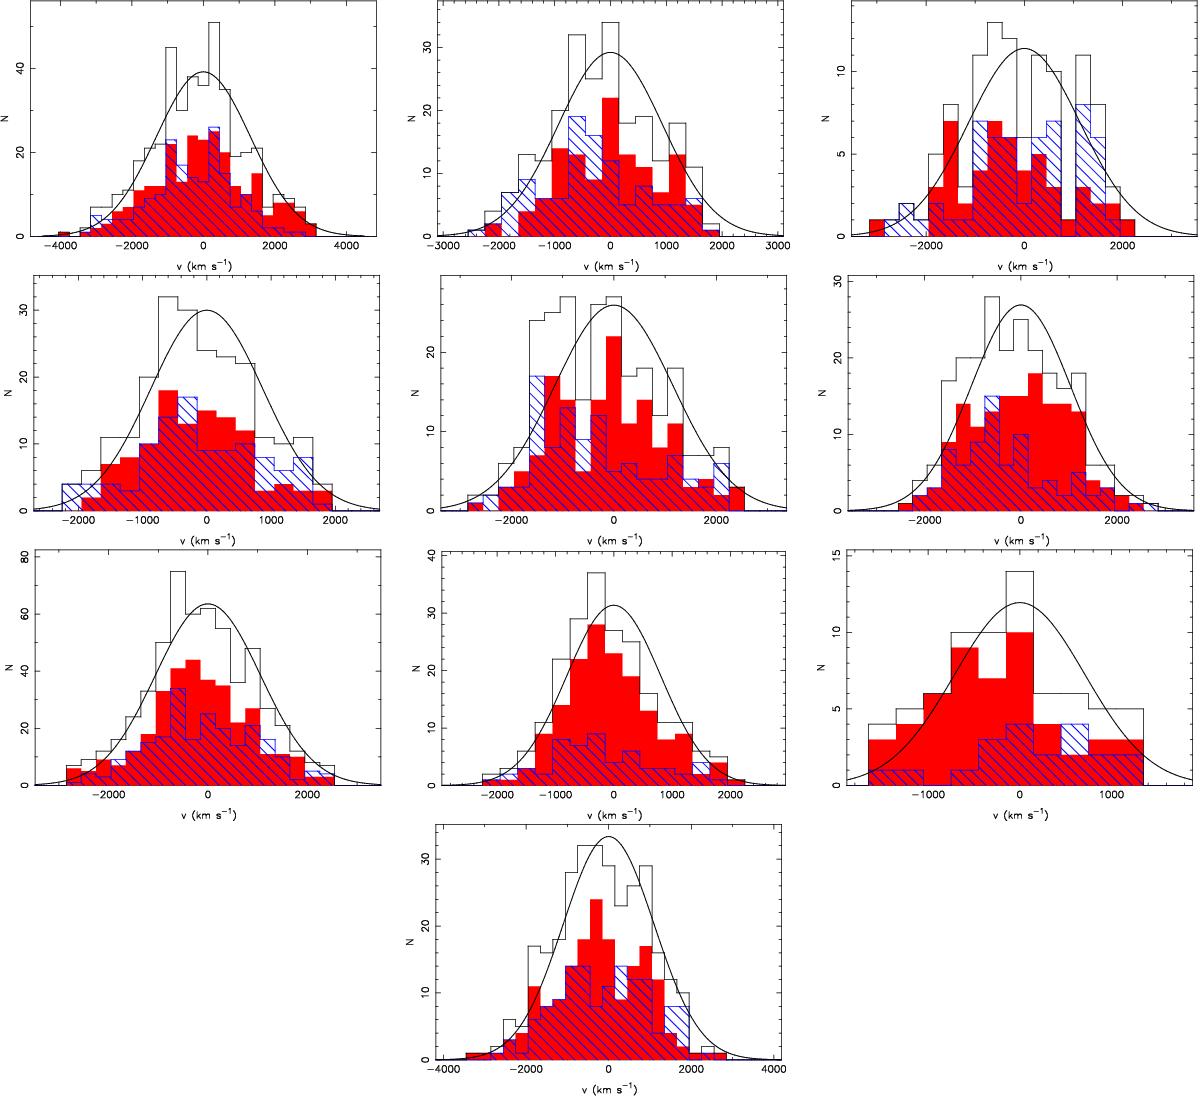
Rest-frame velocity distribution of all the spectroscopically confirmed cluster members (including those outside R200). The red-shaded histogram is for the red-sequence galaxies, while the blue-hatched one is for the blue population. The velocity dispersion of the total population is represented by the Gaussian curve, which is centred on 0. From left to right, top to bottom: RXC J0014, RXC J0225, RXC J0516, RXC J0528, RXC J0658, RXC J1131, RXC J1206, RXC J1347, RXC J2011, and RXC J2308.
Current usage metrics show cumulative count of Article Views (full-text article views including HTML views, PDF and ePub downloads, according to the available data) and Abstracts Views on Vision4Press platform.
Data correspond to usage on the plateform after 2015. The current usage metrics is available 48-96 hours after online publication and is updated daily on week days.
Initial download of the metrics may take a while.