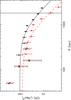
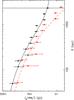
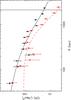
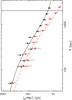
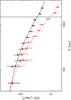
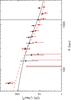
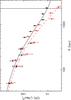
Fig. C.1
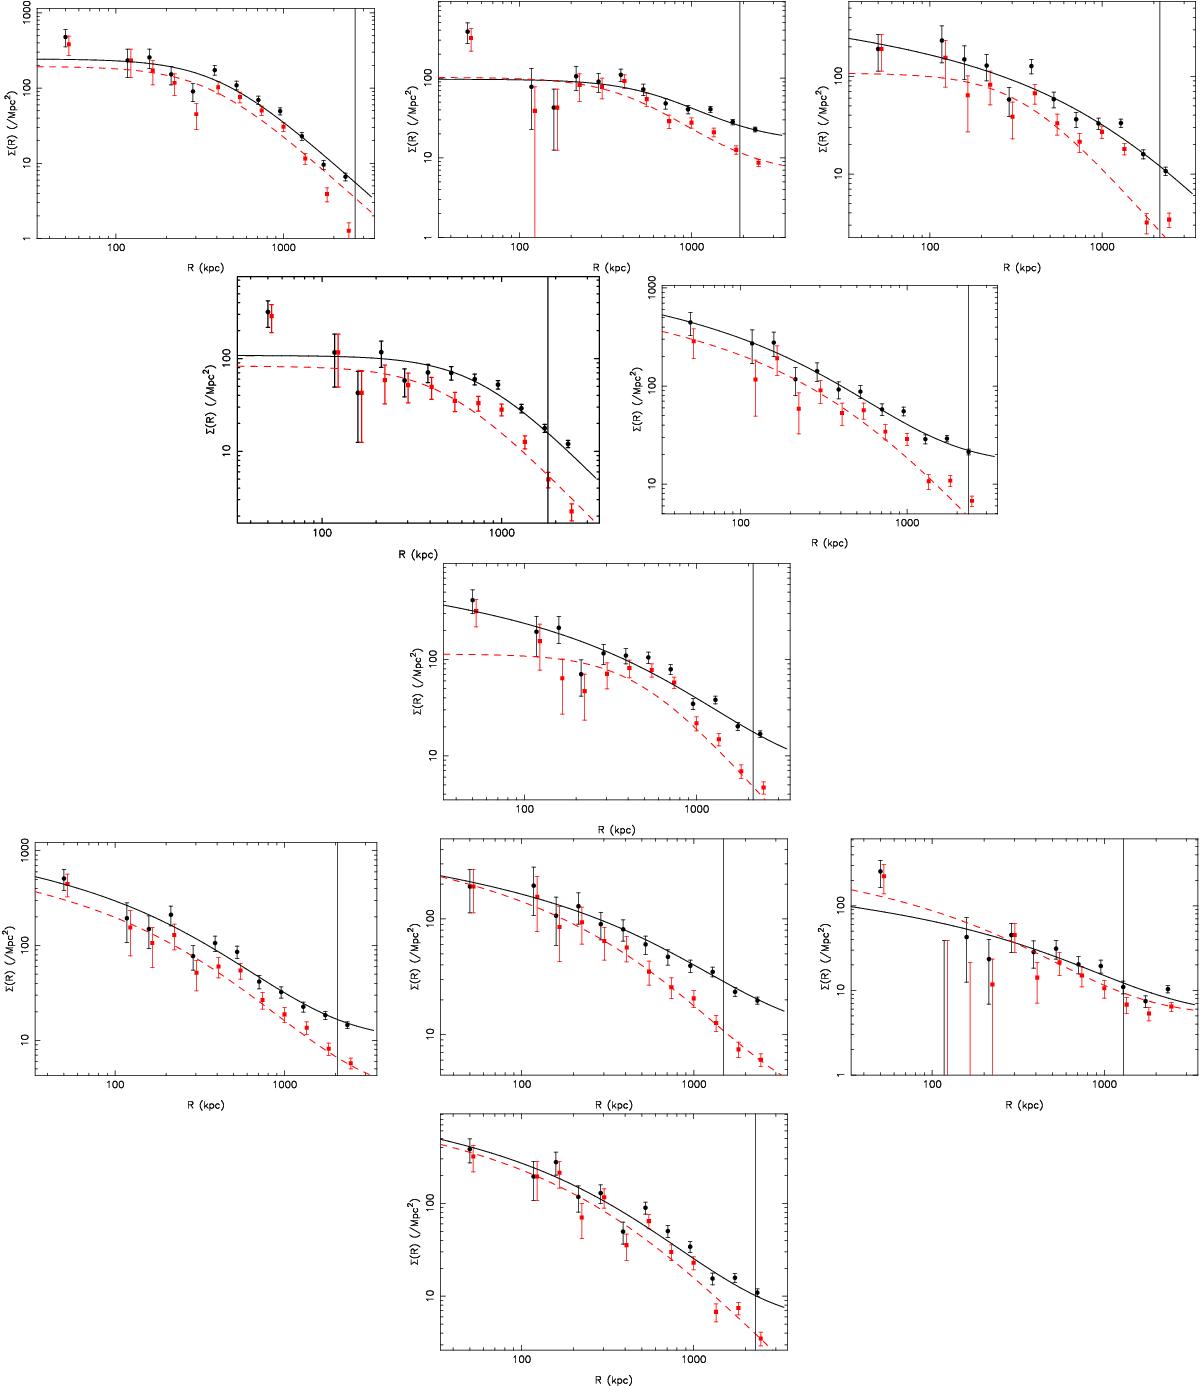
Galaxy surface density profile (black points) and the best-fit model (black curve) combining either a King or NFW profile with a constant background residual. The red-dashed line and red points correspond to the population of red-sequence galaxies. The best-fit characteristic radii are used during the Jeans analysis, and to estimate the SPT correction for the virial theorem. The vertical line shows R200, as estimated from the Jeans equation, prior the substructure analysis. From left to right, top to bottom: RXC J0014, RXC J0225, RXC J0516, RXC J0528, RXC J0658, RXC J1131, RXC J1206, RXC J1347, RXC J2011, and RXC J2308.
Current usage metrics show cumulative count of Article Views (full-text article views including HTML views, PDF and ePub downloads, according to the available data) and Abstracts Views on Vision4Press platform.
Data correspond to usage on the plateform after 2015. The current usage metrics is available 48-96 hours after online publication and is updated daily on week days.
Initial download of the metrics may take a while.