Fig. B.1
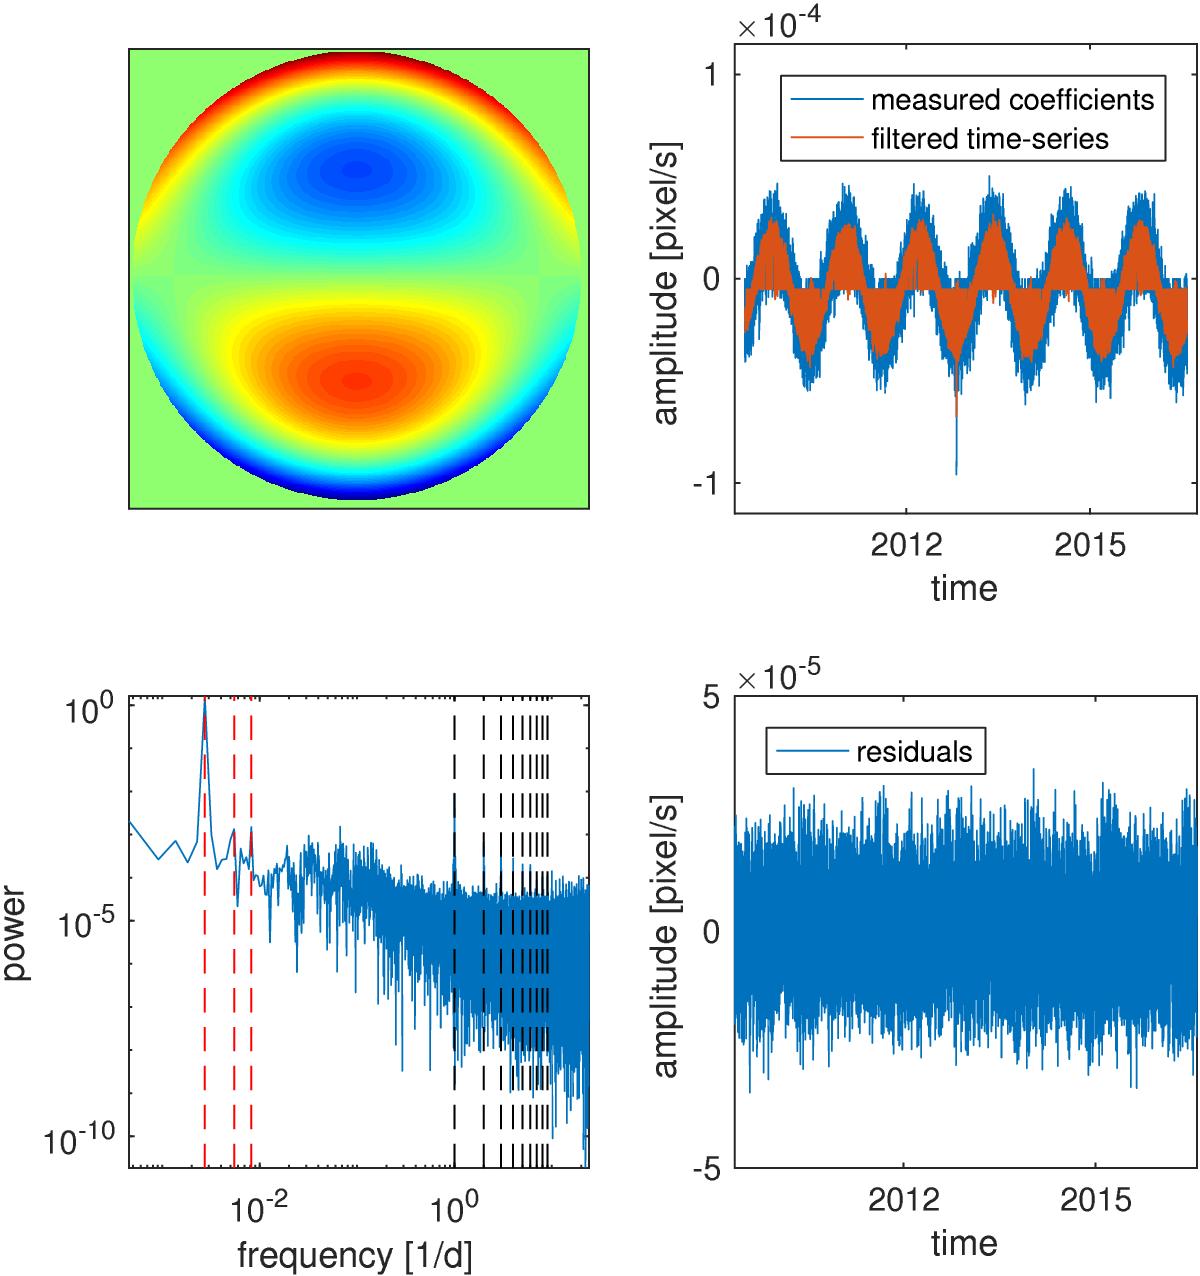
Time evolution of the coefficient for the Zernike polynomial with n = 3 and m = − 1 for vm. The top left panel visualizes this Zernike polynomial, the top right panel shows the time series of the amplitude of the coefficient, both before (blue curve) and after (red curve) filtering in time. The bottom left panel shows the power spectrum of the unfiltered time series. The dashed vertical lines indicate examples of frequencies that are affected by the orbit, by the orbit of the Earth around the Sun (red lines), or by the orbit of SDO around the Earth (black lines). See text for more details about the filtering. The residuals after subtracting the filtered from the unfiltered time series are shown in the bottom right panel.
Current usage metrics show cumulative count of Article Views (full-text article views including HTML views, PDF and ePub downloads, according to the available data) and Abstracts Views on Vision4Press platform.
Data correspond to usage on the plateform after 2015. The current usage metrics is available 48-96 hours after online publication and is updated daily on week days.
Initial download of the metrics may take a while.