Fig. 6
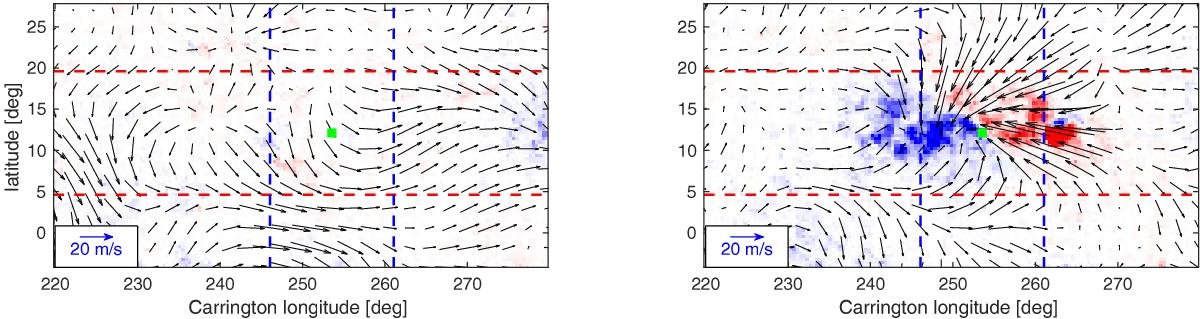
Comparison of the flows around a selected active region (AR 12007, the active region highlighted by the blue boxes in Fig. 3) one Carrington rotation before emergence (CR 2147, left panel) and one Carrington rotation after emergence (CR 2148, right panel). It emerges between CR 2147 and CR 2148 on the far side of the Sun and persists over the entire disk passage in CR 2148 without significant evolution. The images show the line-of-sight magnetic field, the arrows show the LCT flow velocities. The color map saturates at ± 100 G, the magnitude of the flow velocities is visualized in the lower left corner of the individual subimages. The dashed lines indicate strips in latitude (red horizontal lines) and in longitude (blue vertical lines) around the center of gravity of the unsigned magnetic field (indicated by the green squares). In Fig. 7, we show averages of the longitudinal and latitudinal velocities along these strips.
Current usage metrics show cumulative count of Article Views (full-text article views including HTML views, PDF and ePub downloads, according to the available data) and Abstracts Views on Vision4Press platform.
Data correspond to usage on the plateform after 2015. The current usage metrics is available 48-96 hours after online publication and is updated daily on week days.
Initial download of the metrics may take a while.