Fig. 5
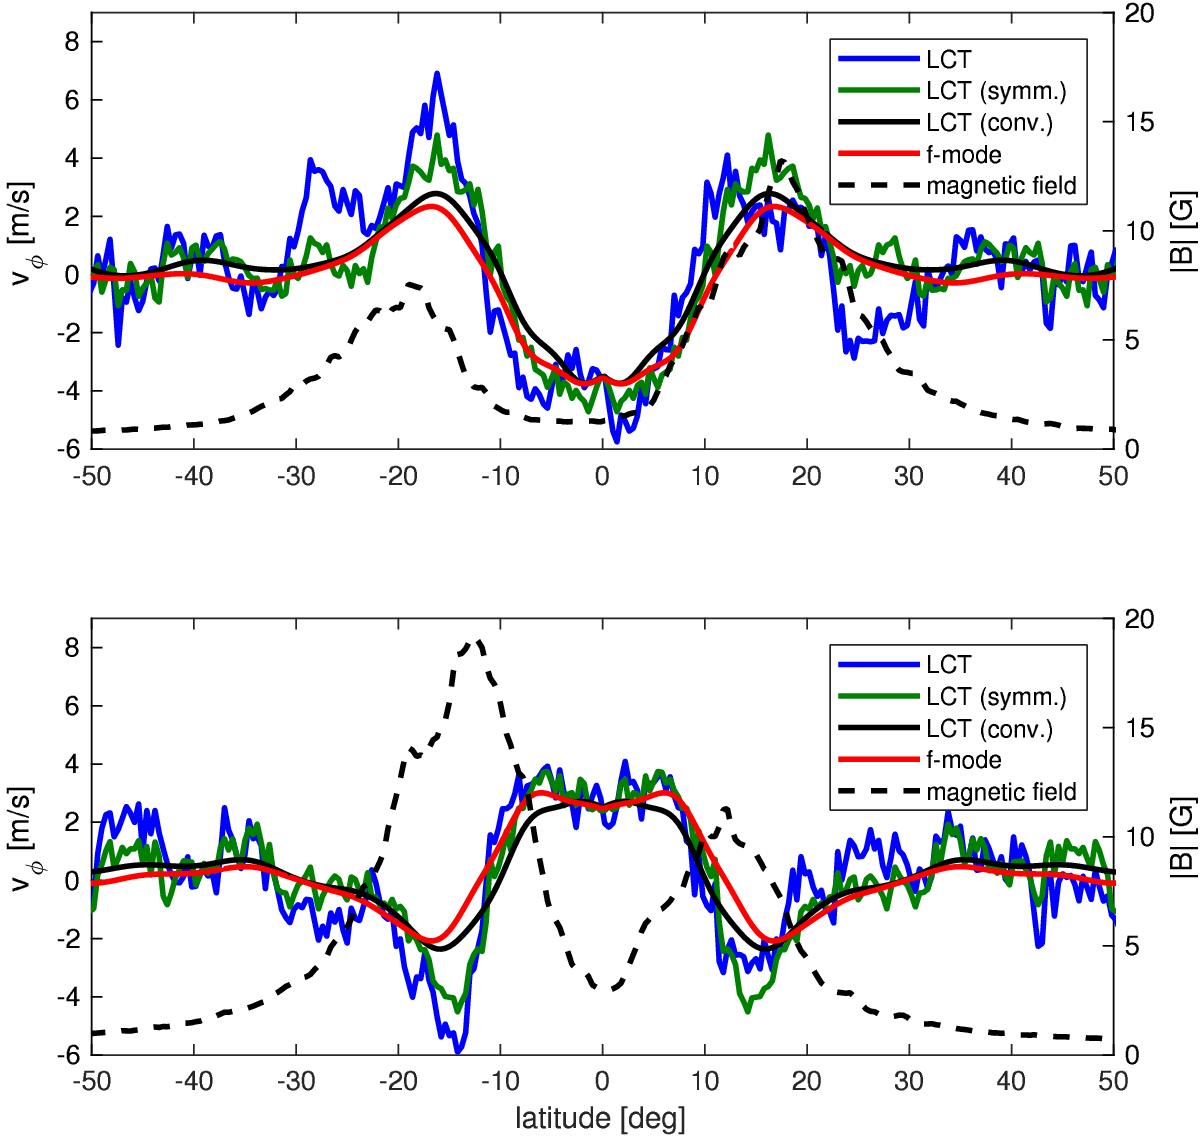
Annual averages of the torsional oscillation data (vφ) shown in Fig. 4. The top panel shows data for 2011, the bottom panel shows data for 2014. The blue curve shows the nominal LCT data, the green curve shows the LCT data after symmetrizing in latitude, the black curve shows the LCT data after symmetrizing them and convolving them with the averaging kernels of the f-mode data, the red curve shows the results from global helioseismology with the f-mode, and the dashed black curve shows the averaged unsigned magnetic field.
Current usage metrics show cumulative count of Article Views (full-text article views including HTML views, PDF and ePub downloads, according to the available data) and Abstracts Views on Vision4Press platform.
Data correspond to usage on the plateform after 2015. The current usage metrics is available 48-96 hours after online publication and is updated daily on week days.
Initial download of the metrics may take a while.